Diversification
More stocks = less risk, but only up to a point — turns out there's this pesky market risk that no amount of diversification can ever kill.
OK so last time we set up two portfolios — a risk-free one $F$ and a risky one $P$ — and inside the risky $P$ we fixed the stock/bond ratio at some level. Then we played with the split between $F$ and $P$, watched how return and risk shifted, and pulled the CAL out of that.
This time? Easy.
That fixed bond/stock ratio inside $P$ — we’re unfixing it. Now we go hunting for the actual best mix. “What ratio of bonds to stocks is the one????”
That’s the whole quest.
Why does this matter so much? When you’re investing, what’s the most important thing?
- Asset allocation (don’t put all your eggs in one basket)
- Market timing
- …uh, stock picking? something?
A lot of economists basically say: “From the big picture, getting asset allocation right is like 90% of the game.” Everything else — timing, picking — is a rounding error next to allocation. heh
OK before we get to the new stuff, let’s run through the thing everyone already knows.
Imagine a portfolio with exactly one stock in it. The risk of this portfolio is just… whatever happens to that stock, right? Cool.
Now toss in a second asset — another stock, or a bond. Call them #1 and #2. They don’t react to the economy the same way. In some scenario, #1 posts a $(+)$ return while #2 posts a $(-)$. Other times the reverse. Each one moves a little differently.
But you’re not holding them separately — you’ve bundled them into a portfolio, and what we care about is how the portfolio behaves.
So from the portfolio’s point of view, what just happened?
The risk went down (risk = $\sigma$).
(Read “risk” here as roughly “uncertainty.” Standard deviation is the distance at which the Gaussian’s probability density drops to $1/e$ — that’s what we mean.)
When one asset’s bad scenario can get partially canceled out by another asset doing fine in that same scenario, the overall risk shrinks. Add a third, fourth, fifth asset — $\sigma$ keeps going down, but the amount it goes down by gets smaller and smaller.
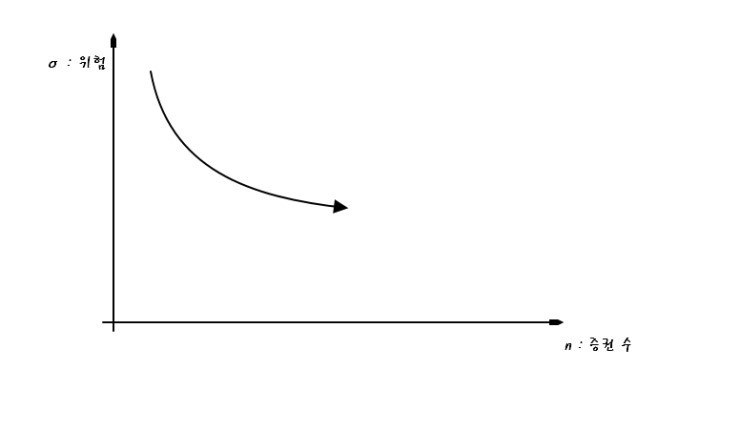
So the curve trends like this — risk falls, but with diminishing returns. Looks about right, yeah?
But why doesn’t risk just go all the way to 0?
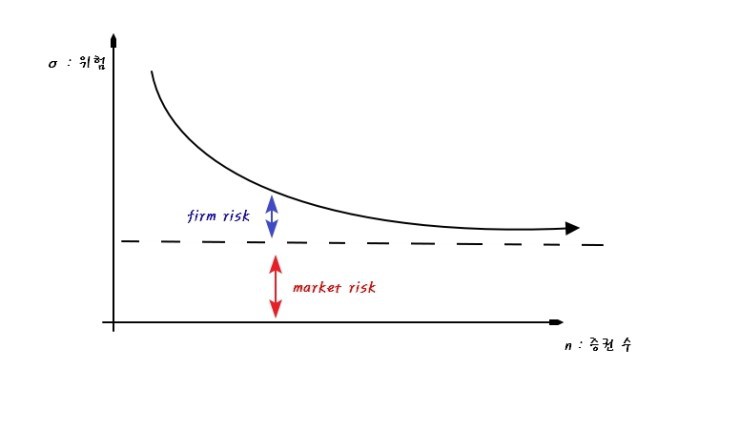
Because every security on Earth shares some risk in common. This is market risk, a.k.a. systematic risk.
So even if you diversify away every individual company’s quirks, the one thing you absolutely cannot hedge is the risk all companies share. War breaking out. A revolution. A meteor. That kind of thing — undiversifiable.
Anyway, the takeaway: through diversification, you can kill all the company-specific risk.
So the graph above, with a couple of reference lines drawn on, becomes:
OK OK OK, so the lesson so far: more stocks = less risk.
(And no, you can’t just count tickers. Buying POSCO and Hyundai Steel is not diversification — those things move together. You need stocks/bonds that are completely, totally, utterly unrelated to each other!)
But there’s something we haven’t dealt with yet.
Up there we only looked at standard deviation — the “uncertainty.” We never thought about return.
You’d want to minimize uncertainty AND maximize return, right? That’s the actual goal.
So now let’s tackle that. Simplest possible portfolio: two assets, stocks and bonds. Remember last post, we’d fixed the allocation inside the risky portfolio? We’re breaking that lock. Now we’re going to figure out: at what split is uncertainty minimized and return maximized?
That’s where we’re heading.
Let me give you the punchline up front. The thing that really drives a portfolio’s risk is:
how much the returns of the two assets move together vs. against each other.
OK, scenarios:
Boom
Stock return: 30% Bond return: -5% Probability: 5%
Normal growth
Stock return: 14% Bond return: 8% Probability: 25%
Mild recession
Stock return: -11% Bond return: 15% Probability: 40%
Severe recession
Stock return: -37% Bond return: -5% Probability: 30%
Wait — bonds going $(-)$ in a boom? Yeah. When a boom is hot enough that inflation accelerates, bond returns can flip negative. Same flavor of logic in the other direction: a mild recession can come with rate cuts, which pushes bond returns $(+)$.
Anyway, the return for the mild recession case works out as:

Calculated like that.
Why am I shoving all these numbers at you? To make the following point: even with a 50/50 stock/bond split, the better you tune the bond mix, the more you can squeeze out of return. I’m setting up justification for the graph we’re about to draw.
But before the graph, let’s get the math tools out.
The whole question above is basically: do the two assets reliably offset each other? When one posts a $(-)$, does the other in the portfolio post a $(+)$ and cancel it?
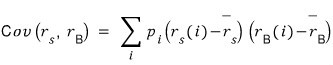
The tools statistics gives us for this are covariance and the correlation coefficient.
Definitions first:

Now let’s open up that formula a little:
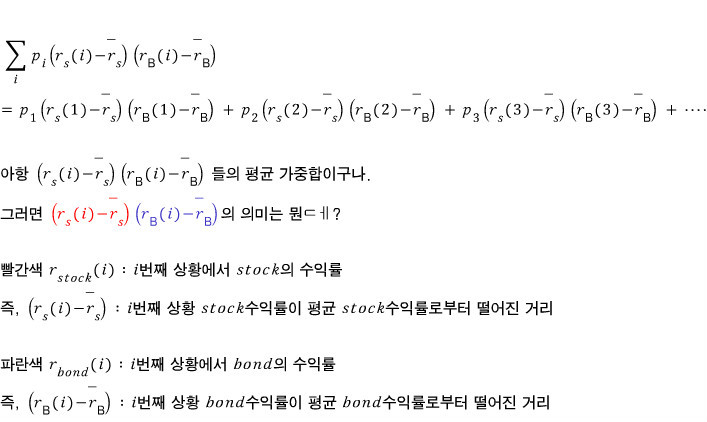
Ahhh OK, this feels more tangible now. It’s a weighted sum — yeah, it’s a weighted sum — but what we’re weighting is the product of how each asset deviates from its mean.
So reading the Cov value:
- “Oh, Cov is $(+)$? Then on the whole, stocks and bonds are moving in the same direction.”
- “Oh, Cov is $(-)$? Then on the whole, stocks and bonds are moving in opposite directions.”
But here’s the catch: interpreting the magnitude of Cov is… kinda ambiguous.
Like — how big does Cov have to be in the negative direction before you’d say “wow, these two really fight each other”? Cov by itself doesn’t tell you that. There’s no built-in scale for “is this a big number or a small number.”
So we normalize. Divide by the standard deviations:
Doing it this way caps the magnitude at 1, so the value always lives in:
Now you can finally say:
“Ohhh, it’s a negative relationship~ (or positive), and it’s a strong one~~~ (or a weak one~~~).”
Now you can actually interpret it.
OK summary time. The reason I dragged you through all that statistics was specifically to say this. So everything above — just nod, “got it,” and then lock in here:
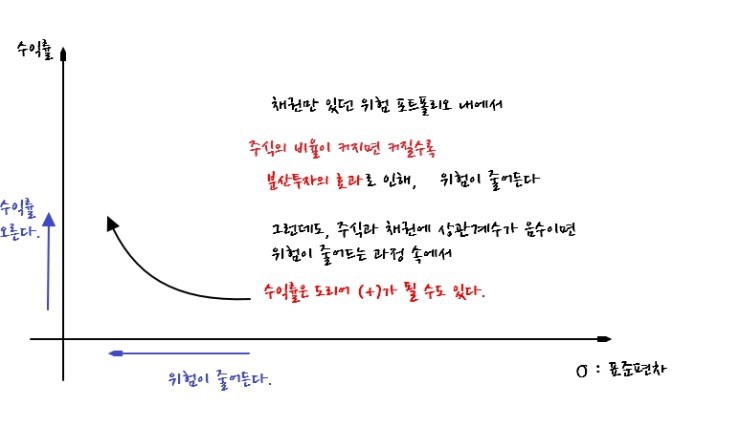
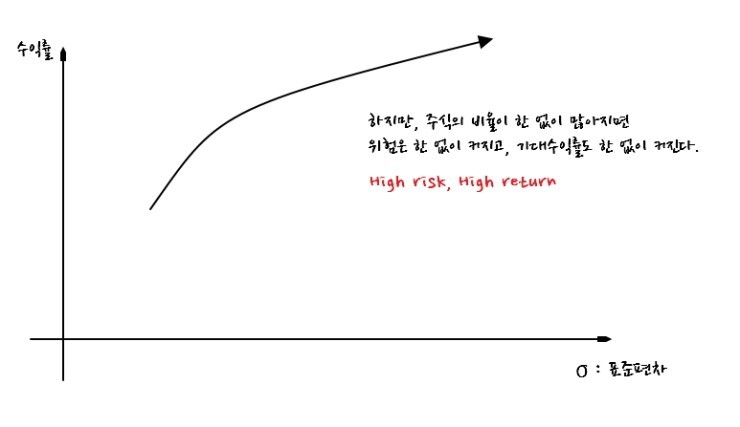
Inside the risky portfolio, if we start from “all bonds” and add stocks, $\sigma$ drops within a certain range thanks to diversification. AND — because we now know stock and bond returns can have a negative relationship — while the risk is dropping, the return can actually go up.
But if you keep cranking up the stock fraction, eventually you’re 100% stocks. Risk climbs without bound and so does expected return.
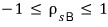
OK OK OK OK OK OK, let’s draw this on axes:
These axes.
First:
Second:
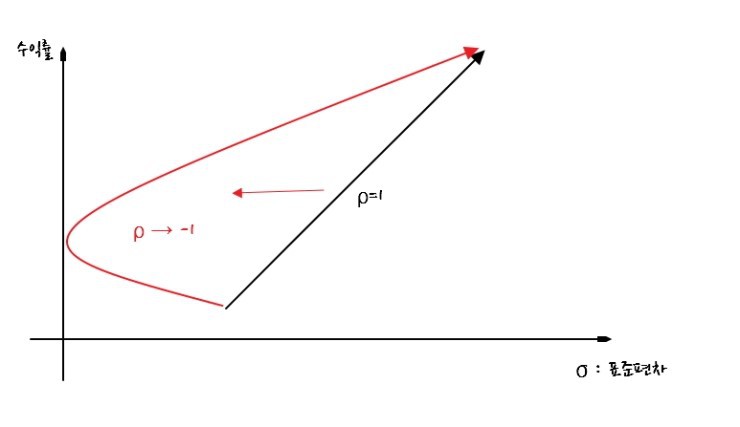
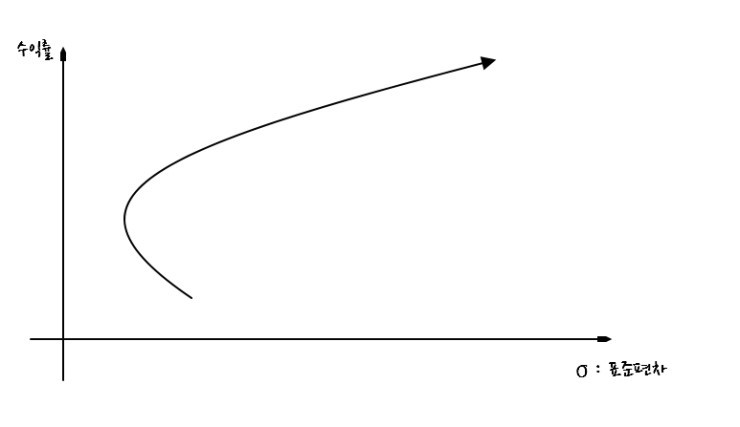
Now imagine we slide the stock weight inside the risky portfolio continuously from 0 (all bonds) to 1 (all stocks):

Comes out looking like thiiis~~~~
OK OK OK, but why does it bend like this? Because the correlation coefficient is negative, right?
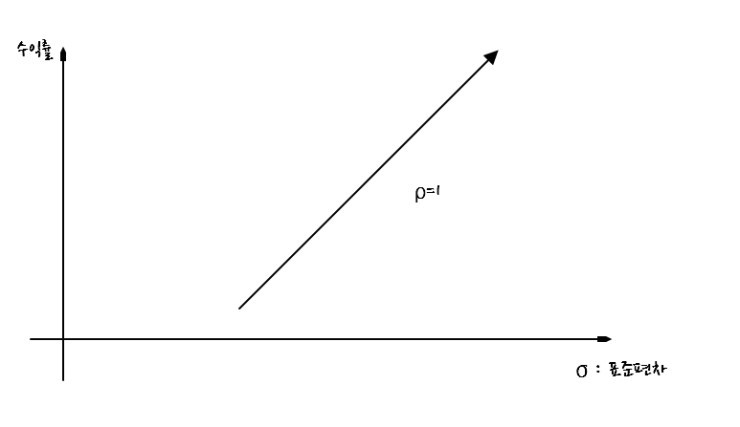
So what if $\rho = 1$? As in, no offsetting at all between bonds and stocks. What does the curve look like then?
It’s just like when we drew the CAL last post — a straight line!!
And as $\rho$ goes more and more toward $-1$, you get:
Now, from last post —

— we already drew something on these same axes, remember? The CAL — risk and return as a function of how we split between the risk-free portfolio $F$ (only risk-free assets) and the risky portfolio $P$ (only risky assets). heh heh heh
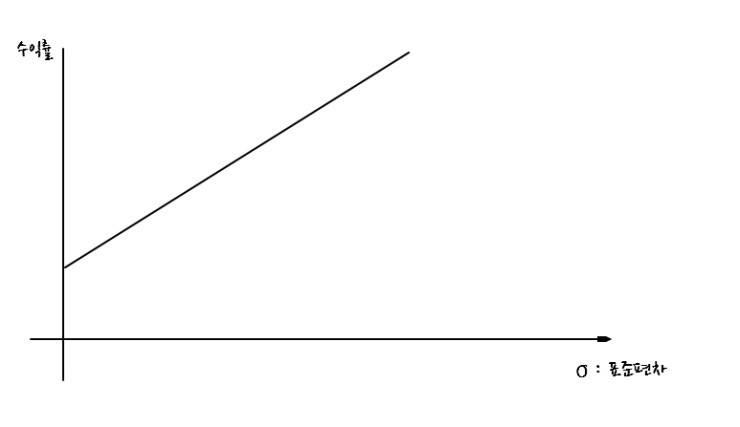
Looked like that. Right, right.
The whole point of that graph was: the slope is the Sharpe ratio, which is the risk premium per unit risk.
And the new curve we just derived:
Putting them together — the conversation is basically: “OK, let’s pick the allocation between $F$ and $P$ in a way that actually makes sense.”
Picking the $F$-vs-$P$ split rationally is the same as: pick the Sharpe ratio well.
What does picking the Sharpe ratio well mean? Pick $\sigma_p$ well! Pick that, and then pick the $F$/$P$ ratio. heh heh heh.
Pick it based on what?
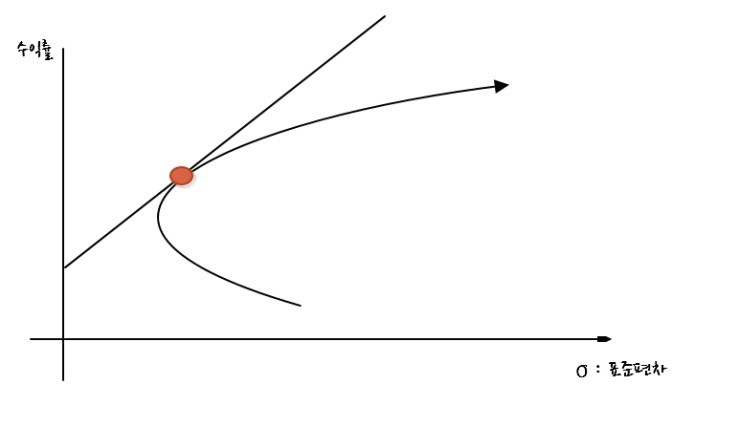
You’d look at this graph and pick the point where everything lines up — least risk for the most return, right?
Buuut apparently that’s not the optimal spot. (Kinda anticlimactic, I know.) The actual optimum is over here:

The way to pick the highest return for the most rational return : risk tradeoff — is right there. heh heh heh.
Originally written in Korean on my Naver blog (2016-04). Translated to English for gdpark.blog.