Inventories (3): LIFO Reserve
A casual walkthrough of how FIFO vs. LIFO choices ripple through key financial ratios — liquidity, solvency, and activity — before diving into the LIFO reserve.
Last time we looked at how individual financial statement line items get pushed around depending on whether you go FIFO or LIFO.
So this time, instead of looking at line items,
we’re going to look at how financial ratios get pushed around.
But to even talk about that, we kinda need to know what ratios exist in the first place,
and we haven’t covered them yet,
so let me just toss out a quick intro right here.
And don’t worry about these ratios too much —
once we’ve gone through all the individual accounts, near the very end there’s going to be one more proper, full ratio summary,
so really, no stress!
Liquidity Ratios
Liquidity = “how easily this thing turns into cash.”
If I rank the top 3 by ease-of-turning-into-cash, greatest to least:
rank 1. Cash (cash is liquidity — that’s the whole thing it’s good for)
rank 2. Accounts Receivable
rank 3. Inventory
(Both A/R and inventory can be sold off at a discount when you urgently need cash. But the discount on inventory is waaay steeper than on A/R.)
Current Ratio = Current Assets / Current Liabilities
Net Working Capital = Current Assets − Current Liabilities
Quick Ratio = (Cash + Accounts Receivable + etc.) / Current Liabilities
The idea behind Quick Ratio is to look at liquidity more conservatively, using only the current assets that turn into cash fast (i.e. ditching inventory),
and apparently it’s a more appropriate yardstick for companies that are sitting on too much inventory.
Solvency Ratios
Solvency is also looking at stability, but where Liquidity is the short-term view, Solvency is the long-term view.
Debt-to-Equity Ratio = Total Liabilities / Total Equity
Debt Ratio = Total Liabilities / (Total Liabilities + Total Equity)
The only difference is whether you divide by total equity or by total assets,
and apparently these little distinctions aren’t really that important…..
Anyway, both are basically the same operation — you take the total amount of debt and normalize it by dividing by something —
so conceptually they’re the same idea.
And yeah, “Total Liabilities + Total Equity” should just equal Total Assets, right?
The reason I specifically wrote it as Liabilities + Equity is
because… Capital is this kind of concept:
And one more thing — Debt and Liability both translate the same way,
but they’re actually slightly different concepts too, apparently :-)
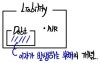
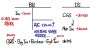
(Oops, over there… pretty sure that should be A/P, not A/R… heh)
When you say Debt, it specifically refers to liabilities that accrue interest, apparently.
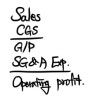
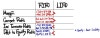
Oh, and since
Gross Profit and Operating Profit might not be super familiar yet,
let me drop this picture too, just as a little “remember this” reference.
Activity Ratios
Activity: financial ratios that look at whether assets / capital are being used efficiently.
This one — translated loosely as accounts receivable turnover — isn’t a concept of literally counting how many rotations,

apparently it works like that.
So let me just go ahead and lay out all the financial ratios that fall under Activity.
(Inventory doesn’t flow through Sales — it shows up and disappears via CGS — so generally the numerator pairs with CGS, apparently.)
(You’re starting to feel the pattern by now. For “Turnover of [whatever],” you basically take the Avg of that thing in the denominator and slap Sales on top.)
(For A/P, it actually connects with Purchases, so some people put the purchase amount in the numerator — but it’s not a hard rule, and stuffing Sales up there the usual way isn’t considered wrong, apparently… Because this isn’t a concept that’s important / precise / rigorous enough for anyone to argue right vs. wrong from the start…)
OK OK OK, last one.
Profitability Ratios
Financial ratios for Profitability include
things called ~~ Margin.
For example,
Operating Profit Margin = Operating Profit / Sales,
and as it looks, it just means “what proportion of Sales is operating profit.”
Gross Profit Margin = Gross Profit / Sales, which is just the proportion of revenue that gross profit takes up,
So the whole ~~ margin family is about: as you walk down the I/S, how much of it survives without leaking away — what proportion did you manage to hold onto down to that line ~~.
“Oh! I’m curious what proportion Net Income makes up of Sales!” — if that’s your question,
Net Profit Margin = Net Income / Sales, and you’d just slap a “net income margin!” label on it and you’d be set.
ROE — well… anyone who invests in stocks knows this one.
It also shows up as a key factor in that book — what was it called, The Little Book That Beats the Market, something like that —
but ROE actually carries serious financial meaning too.
We’ll talk about it again later when we get into financial management or Equity (stocks),
because this ROE value can actually be used to logically derive a formula for a company’s growth rate!
Anyway, ROE….
“Hey, company — out of shareholders’ claims, what proportion of Net Income (the profit that drops down to shareholders) are you cranking out?”
That’s roughly what it answers.
Benchmarking off ROE,
there’s also this thing called ROA.
Just because it was benchmarked off ROE doesn’t mean it carries any particular financial meaning on its own,
and it’s kinda awkward to just say “Return relative to Assets, that’s it.”
We’ll later look at this thing called DuPont Analysis,
and ROA does pull its weight there.
Whew…… if you’re someone reading this fresh, brand-new to accounting,
I’m so so sorry!!!!! It must’ve felt like I was just tossing formulas at you in a totally haphazard order T_T T_T T_T T_T T_T
I was the same way… please, please don’t worry!!!!!
By the time the FRA section is wrapping up, you might end up dropping money on a CPA lecture,
so hurry on over and go drop all your money. But don’t go splurging recklessly heh heh heh.
Anyway, the reason I laid out all these financial ratios was
so we can see how they get affected depending on FIFO vs. LIFO.
And the whole summary basically wraps up in this one table :-)
Based on what we’d previously summed up like this,
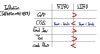
we can now summarize it like this,
only four are written out, but….
I don’t think it’ll be hard to figure out the FIFO vs. LIFO effect on most other financial ratios using the same principle! heh
OK now let’s switch topics.
Different topic, but the content connects.
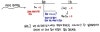
There aren’t any companies in Korea that use LIFO, but in the US there are, right?
And you can’t just freely compare a FIFO company against a LIFO company, can you?
So we need a way to convert one side to the other.
And lucky for us,
there’s a regulation that says: “Companies using LIFO are required to disclose ‘LIFO Reserve’ in their footnotes.”
Basically a “here’s what it would’ve looked like if we’d used FIFO~” line item.
Why?!? Why was this obligation slapped specifically on LIFO companies…..
Because LIFO is seen as something that lets companies juice their profits plenty.
Even if a company can’t control its sales volume, it can control its purchase volume, right?
When it wants to report higher profits, it cuts back on purchases so that ancient inventory bought way back when gets recorded as sold — adjusting CGS that way,
and profits can be massaged plenty. (Prices generally trend up — central banks usually target like 3% inflation.)
So IFRS just shut LIFO down completely, to kill even the possibility of this kind of plausibility-of-shenanigans.
What Is LIFO Reserve?
“Account by which LIFO inventory is less than FIFO inventory”
And one more important thing!
As the word Reserve hints, LIFO Reserve is “a value that’s been accumulating ever since the company was born”!
How is it calculated?
In the normal world where prices are rising, FIFO records CGS at a smaller amount, so FIFO Inventory ends up bigger.
So in general, LIFO reserve is a value that just keeps growing and growing!
OK so now that we know LIFO reserve is a thing, let’s see how to actually use it —
we’ll do the simple version first, then the more complicated version after that, heh.
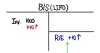
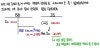
The B/S method goes like this.

Bump up the reported inventory value by the LIFO reserve amount.
The matching amount on the debit side has to also show up on the credit side, and we handle that by bumping Retained Earnings to match.
And along with R/E, we knock down Cash by LIFO reserve × tax rate.
(You can think of it as: to the extent FIFO would have measured profit higher, more would’ve gone out the door as taxes — we’re correcting for that.)
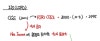
Now the I/S method.
It’s the method for converting LIFO CGS into FIFO CGS,
and it works out like this.
Intuitively: since CGS is what shows up on the I/S,
the LIFO-vs-FIFO discrepancy for just the current period’s amount is what you correct by — that’s roughly the picture.
A delta (change-amount) value pops out and it looks a bit fiddly,
but we can derive that too from the basic inventory formula.
What’s the basic inventory formula?!
Existing accumulated inventory + inventory you purchased = amount sold + amount remaining, right?!?!?!
But, like we said above, converting LIFO inventory to FIFO inventory means tacking on the reserve value,
so if you set up those two equations and solve them together,
you can derive the formula — just FYI heh heh heh.
Now that we’ve got the rough feel, let’s go into the details a little more.
First, simple case, tax rate = 0%,
Ending LIFO reserve = 10,
Beginning LIFO reserve = 5,
Ending Inv = 1000,
Current period CGS = (3000).
Say you saw a LIFO-based financial statement laid out like that.
If we apply the simple B/S method we just learned,
since the tax rate is 0%, we don’t even need step 3.
And the B/S is done.
But there’s something extra worth thinking about here:
let’s actually pin down the identity of that R/E bump that pops up when you convert LIFO base to FIFO.
We just said LIFO CGS → FIFO CGS conversion is
that formula from above,
i.e. this,
There’s clearly a +5 effect on Net Income,
but we just plugged +10 into the B/S a second ago???????
What’s going on here?????????
Right — the answer is that LIFO Reserve is a value that’s been accumulating ever since the company was born.
So the +5 effect from before the current period (everything pre-this-period) has already been “consumed,”
and then this period brings another +5 effect on top.

OK now let’s look at a slightly more complicated situation.
Totally ridiculously complicated lol lol lol — say the tax rate changes from 20% to 30%,
and we’ve got a brand-new company that started life with a LIFO Reserve of 0, finished year 1 with a LIFO reserve of 5, and closed year 2 with a LIFO reserve of 10.
Wow, literally everything that could change actually did lol lol.
Let’s give it a shot. First, year 1.
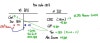
- Red,
LIFO reserve went up by 5 in year 1, so we reflect that in inventory, and
- Blue,
reflect it in Retained Earnings,
- Green,
then over on CGS, reflect the change-amount portion of LIFO reserve as −5,
the full +5 effect doesn’t make it to Net Income —
since the tax rate is 20%, 20% of 5 = 1 gets sliced off and deducted from the R/E that we’d just bumped up,
and ultimately a +4 effect lands in Retained Earnings and Cash.
Now to year 2.

- Red,
Since the LIFO reserve value (the level, not the change) is 10 at this point, first reflect 10 in inventory,
- Blue,
and reflect 10 in Retained Earnings too.
3-4. Green,
Over on CGS, the change this period is again 5, so we pass −5 through CGS,
and since the tax rate this time is 30%, 1.5 gets sliced off as tax — pulling that out of Cash and R/E,
and the remaining +3.5 effect lands in R/E and Cash.
5-6. Orange,
Now for Cash — this period we just ate −1.5, but there’s also last year’s −1 effect that needs to be subtracted again.
That’s because the −1.5 we just absorbed only covers this period’s effect.
Also — last year’s −1 effect lives in R/E too, so R/E has to take a −1 hit as well!!!
- Pink,
So for R/E, starting from the initial +10 entry, then reflecting −2.5, we end up with a +7.5 effect.
And it lines up perfectly. Last year +4, this year +3.5.
Total 7.5. How clean is that?!
The chance of this showing up on an exam in this kind of fully-cranked-up form is pretty low, but
apparently in situations where the tax rate changes like this, the orthodox approach above is the more reliable one,
so it does seem like we need to actually understand how LIFO Reserve works at this level.
Anyway — because of this principle, where the B/S accumulates over the entire history since the company’s founding while the I/S only reports the current period’s performance,
you can see the principle for why, once a company starts fudging the B/S, it has no choice but to keep on fudging.
(What I’m about to bring up is a side topic!! Just a fun aside!!! It’s NOT about FIFO or LIFO!!!!!!!!)
OK OK OK OK — because of how things accumulate on the B/S,
“This is exactly why most uncovered accounting fraud cases that involved inflating ending inventory weren’t done over just one year — they were repeated over multiple years!”
Whether the inventory really exists as the financial statements claim — at year-end an accountant has to physically go and count it all…..
Apparently it’s the junior accountants who actually count them… going out to farms and literally stamping each pig one by one to count how many are there….
Apparently they really do that.
Anyway — even with all that verification, if a company makes up its mind to lie, it can still inflate things,
Say they inflated inventory by 20,000.
In that formula,
the left side stays the same, and since they only want to pump up ending inventory,
CGS naturally drops by 20,000,
and flowing through the I/S, that lands in R/E as a +20,000 effect.
And it’d be nice if this one lie were the end of it, but —
if next year they want to come clean and stop lying,
heh heh………. they can’t just quietly drop the inventory value…………
To balance debits and credits,
they’d have to book a 20,000 loss.
But if they were the kind of company that could just absorb a hit like that, would they have lied in the first place……
So there’s this principle: one lie cannot stay just one lie — it has to keep going.
(From an accounting newbie’s perspective, this is honestly kinda fascinating heh heh heh haha haha haha)
OK then — let me introduce LIFO Liquidation, the last topic of this post, and wrap up!
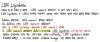
LIFO Liquidation refers to,
in a company that’s using the LIFO cost flow assumption,
“the phenomenon where old inventory gets recorded as sold and profits suddenly spike sharply.”
Why do profits suddenly spike when old inventory is sold off….
I mentioned earlier that prices generally trend up, right????
So when old inventory gets cleared out fast, the costs hitting CGS come in smaller and smaller,
and profits can suddenly pop and surge.
That is — in a deflationary world, old inventory selling off would cause no issue.
But if management deliberately delays purchases,
driving old inventory out the door…… yeah……… that could be seen as financial statement massaging…..
Buuut — just because LIFO Liquidation happened, automatically calling it financial statement massaging is also a bad move.
Because maybe the company genuinely couldn’t purchase, through no fault of their own….
Could be a strike, could be a materials shortage, right?
And finally — why???????? do we use the word Liquidation —
LIFO uses an accounting treatment where the most recently purchased, most expensive inventory is recorded as sold,
so costs are booked big, profits are booked small, less tax goes out the door,
and this is thought of as the company enjoying a “tax benefit.”
Having enjoyed that benefit and accumulated its cumulative effect,
when the old inventory finally gets swept out and sold, all those benefits are said to be “liquidated,”
and that’s why this phenomenon is called LIFO Liquidation. heh
(I love both Professor Gwon O-sang and Professor Kim Jae-ho. Sincerely ♡)
Originally written in Korean on my Naver blog (2021-05). Translated to English for gdpark.blog.