Financial Ratios (1): Financial Analysis Techniques
A breezy intro to why financial ratios are surprisingly tricky — cross-company comparisons, IFRS vs US-GAAP headaches, the Samsung problem, and whether a 200% debt ratio is even bad.
OK so up till now we’ve been picking through individual account items one at a time.
Now that we can roughly understand what people mean when they talk about financial ratios, let’s chat a bit about that and then move on! hehehe
First off, if you’re studying this for exam purposes, you gotta know stuff like this. (T_T)
sob sob, this stuff isn’t even fun….

“Pick the correct answer about the disadvantages of analyzing things with financial ratios” —
yeah, a question like this could totally show up! So I figure we should just skim through it once and keep moving. hehehe
Financial ratios….. we’re gonna be running into a ton of them from now on…. you know the kind of thing — debt ratio, leverage ratio, all that stuff!
When you actually try to use those things to evaluate a company…!??
So… first of all, this stuff is only useful for comparison, and obviously trying to use it to evaluate the company itself is… out of the question.
And in our country we’re at least trying to standardize everything under IFRS, but in the US, you’ve got companies on US-GAAP and companies on IFRS all mixed together, so it’s pretty awkward to just compare them head-to-head.
But even between two companies that both follow IFRS, comparison is honestly still kinda awkward.
Because IFRS is principles-based, there are a bunch of options management can pick from.
Like… hmm, what’s a good example…. financial liabilities can be classified as FVOCI or FVPL, that kind of thing.
Because for FVOCI, the interest income flows through OCI and doesn’t hit period profit/loss, while for FVPL, the interest income does hit period net income —
so even if you try to compare ROE between two companies, the basis for what’s flowing into Net Income is different between them…..hahahahaha
anyway…..that’s how it is.
The third point, what does it mean —
what business is Samsung Electronics actually in? haha
Galaxy? Semiconductors? Home appliances……?
So should you compare Samsung against SK Hynix? Or against Apple? hahahahahahaha
hahahahahahahahahahahahahahahahahahahahahahahahahahahahahahahahahahahahahahahahaha
No answer~
For situations like this, there’s actually a saying that goes —
Samsung is Samsung. hahaha Doesn’t matter if it’s semiconductors or whatever, Samsung is just Samsung. hahaha
Number 5 — I think that’s content we’ll get into later when the debt ratio topic comes up. hehehe
Imagine a debt ratio of 200%.
Is that a bad thing????????????
Then is 199% fine???
Is 100% really fine, and is 50% extremely extremely extremely fine?
Couldn’t it actually be a problem if the company has no debt at all??????
I mean, who decided 200% was the magic number anyway hahahahahahahahahaha
We’ll dig into this more later. hahaha
The fact that there are also two methods for analyzing financial statements —

You can take the info from a specific fiscal year and analyze it,
or you can take the info on how things have shifted over time and analyze that.
(YoY is… what you say when you’re working with quarterly statements, meaning year-over-year vs the same period last year!@!)
OK OK, that’s enough.
Now let’s talk about what the various financial ratios are
and what they actually mean!!!
(Oh, of course, for exam purposes the meaning isn’t important. If you’re in a position where you just need to do well on the exam, the most important thing is just to memorize well, calculate well, and not screw up!!!)
This is gonna be absolutely megaton-level fun, so buckle up RIGHT NOW!!!! hahahahahahaha
Let’s GO!!! We’re off!!!!!!!!
First, let me list out the Turnover Ratios!
Before that — the lens we’re going to use to look at the turnover ratio indicators —
we want to see whether the aorta running out of the company’s heart is pumping along nicely.
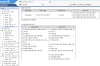
And this aorta thing — https://blog.naver.com/gdpresent/222294377158
Balance Sheet [My CFA Study #1. FRA(1) (Financial Reporting Analysis)] Let’s begin the hell that is FRA! First, what subject does Financial Reporting Analysis study…. fina… blog.naver.com
I touched on it briefly there, but let me say it again. heheheheh
What I’m trying to talk about here is —
A company — at least a corporation — was literally born for the purpose of making money. The Commercial Act apparently defines it that way.
Anyway, this company, in order to make money, is gonna start by building up machinery, equipment, patents, that kind of thing inside the company.
With these tangible and intangible assets, what’s the company’s goal?!??!?!?!?
To make something that can be manufactured or processed and sold, right????
What gets stocked up inside the company so it can be sold corresponds to the line item we call inventory in the financial statements.
And once inventory is built up, the company now has to seriously go out and actually sell the stuff, right????
I hear that companies that pay each other in straight cash for B2B transactions are pretty rare — credit is the norm.
So from the selling company’s perspective, the “we have money coming to us from selling inventory on credit” amount stacks up in the line item called accounts receivable,
and once that actually comes in as cash, it shows up nice and clean as cash and cash equivalents on the B/S. heheheh
Now, what’s the company gonna do with that cash????????????
In order to make even MORE money, they’re probably gonna build up or acquire more tangible/intangible assets!!!!!!!!
(Of course, this is the story for when the market is growing and the company is also still growing — for cases where the market itself has already fully matured, like telcos or financial firms… those companies will redistribute earnings as dividends, and that’s why their stocks end up classified as dividend stocks.)
Then blood flows back into tangible and intangible assets again,
and the pumping just keeps going!!!!!!!!
That’s what I meant when I called it the company’s aorta.
And the financial ratio called ‘XX Turnover Ratio’ is what calculates how well this aorta is flowing, expressed as a ratio between financial line items.
So when calculating turnover ratios, you generally put Sales (from the I/S) in the numerator, and the denominator is some line item from the B/S — and that B/S value should be the Average value.
Why? Because the I/S is something that represents performance over a period.
Like, if you slice out fiscal year x5, how much was revenue during that accounting period, how much interest got paid, how much corporate tax got paid,
deduct everything that needs to be deducted, and report how much net income for the period was —
that’s what’s on the I/S.
On the other hand —
the B in B/S stands for Balance, and “balance” here doesn’t mean equilibrium — it means “balance/remaining amount.”
So let’s say tangible assets had a balance of 1,000 won in year x1, and tangible assets had a balance of 5,000 in year x5.
Then that 5,000 of tangible assets in x5 —
since it’s the cumulative balance from when the company was born all the way through x5 —
you can’t tell if it was 3,000 at the start of x5 and grew to 5,000 by year-end,
or if it was 1,200 at the start of x5 and grew to 5,000 by year-end.
So what the Average value means is —
you take the average of the line item’s beginning and ending values for the year,
and say “on average, during this accounting year, this line item was about such-and-such” —
that’s what’s going on.
OK then, let me just lay it all out.
The turnover ratios introduced here are 6 types.
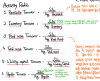
You can think of the numerator as just Sales for all of them,
except when the denominator is Inventory —
what actually leaves inventory and shows up on the I/S is cost of goods sold, right?
Because the journal entry itself is —
Cost of Goods Sold xxx | Inventory xxx
like that. (You don’t really need to know journal entries, though.)
So for inventory,
and for accounts payable (Account Payable), which gets recorded when you buy inventory on credit —
(of course the journal entry there is also Inventory xxx | Accounts Payable xxx.)
you use a better-matched value in the numerator,
and this isn’t a hard rule or anything — if you just use Sales nobody’s gonna arrest you,
it’s just that since this is a textbook, it’s giving you the standard convention, so? that’s why it’s set up like this — apparently…
Anyway, for exam purposes, the most important thing is to look just up to here, memorize well, and not blow the calculation,
but as you can also see in the photo above, I went ahead and pasted in a bunch of practical talk about these line items. hahahahahahah
It’s mega super fun.

Let’s think about the Receivable Turnover Ratio.
The calculation itself is Sales / Average Accounts Receivable,
so the meaning is: we’re looking at how much sales an average of 1 unit of accounts receivable was tied to.
So this value comes out low when accounts receivable is high or sales are low,
(Even if it was sold on credit, it still gets recognized as revenue! Just because you sold on credit and the cash hasn’t come in yet doesn’t mean it isn’t revenue! Because we’re on accrual basis!)
and you might think “huh, somebody out there is paying us late” — and then wait? Isn’t that gonna become a liquidity problem?? — that’s one way to read it.
Plus there’s a chance it gets clipped down later via bad debt write-offs….
You might think “OK so receivable turnover ratio always being high = good,”
but for stuff like this you really need to understand the industry first. For example — say it’s a construction company.
Generally a construction company gets paid by the client (the company that orders “please build me a building!”) and then passes that money along to subcontractors,
and apparently from the construction company’s perspective, they try to give that money out as slowly as possible.
But I hear that if they delay it too long legally, the subcontractors can lie down on the job and a path opens up where the subcontractors get paid directly by the client,
and in that situation, that construction company’s Receivable Turnover Ratio apparently shoots up dramatically.
So basically — the construction company actually had a liquidity problem and was dragging its feet on paying,
but because the subcontractors lay down, the clients ended up paying them directly,
so the accounts receivable turnover ratio just spiked!!!!!!!!!!! — if it’s a situation like that,
this is a serious Warning Sign, isn’t it?!!?!!!??!?!?!?!?!
That is — it can be straight-up dangerous to look at a high accounts receivable turnover and unconditionally call it good…….
heh heh heh heh heh heh heh heh heh heh heh heh heh heh heh heh heh heh
Let’s look at another one.

What do you call this — Fixed Asset, well, non-current asset turnover ratio I guess —
for the Fixed Asset Turnover Ratio, which is supposed to tell you whether investment assets like machinery and equipment have been deployed appropriately,
what would it mean if the value comes out too low? You might say — isn’t there too much non-current asset piled up on the company’s B/S?
(This is something you’ll learn way more about on the financial management side — it’s called Operating Leverage, and trust me you’ll learn so much more more more more more about it later, don’t worry.)
But does it have to mean that???!? It could be that management was super optimistic about the future of the market and made aggressive, proactive investments way ahead of time.
That is — you can’t just say low value/high value = bad/good across the board.
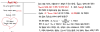
The total market cap of every listed company in the Republic of Korea is only about 3.5% of total global market cap.
I’m pretty sure Apple alone has a bigger market cap than all of Korea’s KOSPI combined,
https://news.mt.co.kr/mtview.php?no=2020082009314594233
Apple, worth 2,350 trillion won… bigger than KOSPI and KOSDAQ combined - Money Today. Apple has become the world’s first to surpass a market capitalization of 2 trillion dollars (about 2,350 trillion won). It is larger than the combined market capitalization of Korea’s KOSPI and KOSDAQ. After overtaking KOSPI’s market cap in December of last year… news.mt.co.kr
yep that’s right hahahahahahaha KOSPI and KOSDAQ together still don’t beat Apple
anyway, our stock market is that small….
But — in 2018, the company that took the global #1 spot for operating profit margin (operating profit as a share of sales), at around 50%, was SK Hynix….
That kind of result would be a stretch even for the “let’s go Bio!!!!” pump stocks, so the fact that a manufacturing company pulled it off is even more more more more more more nonsensical,
and the reason Hynix was able to deliver this kind of performance —
is because the semiconductor industry is fundamentally a capital-intensive industry, apparently.
That is — it’s an industry where you have to plaster massive fixed costs onto the balance sheet to build factories and crank out enormous volumes,
an industry where you have to pour in operating leverage to absurd levels,
so the volume of sales here swings hugely depending on whether the market is booming or in a slump, apparently.
(That’s why lately with the semiconductor super cycle, it looks like both Samsung and Hynix are pouring crazy amounts of money into building factories and stuff, piling on more operating leverage.)
That is — judging just by Fixed Asset alone can be way too much of a stretch….
You need to read the market itself alongside it, and read between the lines……
One last one! heh
Total Asset Turnover
When you compare total assets on the B/S with revenue on the I/S,
obviously total assets is gonna be way bigger, right?????? — that’s the story for manufacturing,
but for a service-sector company, the core asset of the company is the people, and that kind of thing doesn’t get recorded, right?????
Whoa — does this even make sense????
Is it possible for revenue to be larger than total assets?
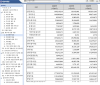
So I went and pulled up the financial statements of an advertising agency called Eco Marketing,
I should’ve found a more decisive example,
but I’ve got all the data so I figured I’d just run it for fun, and I just ran it for fun —
it’s a company called Hyundai Corporation and
hahahahahahahahaha sales revenue clocks in at about 2x total assets hahahahahahahahahahaha
Wow hahahahahahahahaha
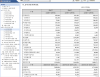
Anyway, there are even plenty of cases where the Asset Turnover Ratio comes out above 1 and even above 10,
but — it’s that kind of industry and the Asset Turnover Ratio is less than 1??????????????
There’s a high chance that’s because so much money has been made that Cash has gotten too fat,
and is just having a ton of cash on hand unconditionally a good thing?????? Hey, if you’ve made money you should hurry up and reinvest it to make even bigger money,
and if you can’t find a place to reinvest, you should buy back treasury stock or pay out more dividends -> at least that way ROE goes up,
(treasury stock is a contra-equity account, and if you pay a cash dividend, retained earnings flows out as Cash, so equity decreases and ROE goes up)
OK OK OK OK and this time —
since Turnover Ratio came up, let me tag on something extra here
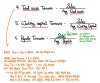
— a story we couldn’t tell earlier. And that’s about the Operating Cycle.
What it’s about is —
we want to look at the info on “the period from when inventory is purchased through to when cash is recovered” in days rather than as a Ratio, just to get a rough sense.
So first, let’s lay down a time axis and walk through it from when the company buys inventory to when cash gets recovered.

The company buys inventory on credit,
pays off that credit,
sells the inventory on credit, creating accounts receivable,
and later collects on that and recovers cash —
and each of those periods has a name attached to it.
Take a look at the diagram.
The reason I’m bringing this story up now is because the Turnover Ratios are what we use to calculate these periods. hehehe
Talking about it through the Inventory T/O Ratio —

following logic like this, DPO, DIO, and DSO are defined using an x-value derived this way.
The point is absolutely not to look at this rigorously — it’s just for getting a rough feel, apparently.
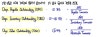
So writing out the conclusions for DPO, DIO, and DSO —
On top of that, there’s an additional concept called the “cash conversion cycle.”

On this time axis, the company has no cash during periods 2 and 3,
so think of periods 2 and 3 as the cash conversion period — the number of days it takes to convert into cash — that’s the cash shortage period,
and using the values we found above with some addition and subtraction, there are two ways to calculate the Cash Conversion Cycle.
Total period (operating cycle) - DPO (period 1)
DSO + DIO (periods 1~2 + period 3) - DPO (period 1)
Like that!!!!
Do you remember the lower-of-cost-or-net-realizable-value treatment for inventory?????
When inventory gets written down…. it’s basically an impairment-loss kind of thing where the value gets clipped because it’s gone bad economically,
and when inventory value drops like that, the Inventory Turnover Ratio mechanically goes up,
which makes the DIO period look shorter,
and so the Cash Conversion Cycle suddenly looks like it shrank.
So this value too — same as everything we’ve seen above —
you shouldn’t just blindly say “the less time it takes to convert to cash the better” —
you have to be able to read between the lines on why!?! that value came out small,
by considering the market and the company and all that……
It applies here too……(T_T)
One thing to note —
the textbook didn’t actually use the terms DSO, DIO, DPO.

The textbook used the terms written on the right side,
but I’m using unified terminology instead of the right-side terms so we can bundle everything together and see it all at once.
Wow…. I was trying to look at all the various financial ratios in one shot here,
but unexpectedly… this is getting long…..?
I’ll split it and write it as 2 parts!
See you next time~~~~~ heh heh heh heh
https://blog.naver.com/gdpresent/222460943266
Various Financial Ratios (2) (Financial Analysis Techniques 2) [My CFA Study #20. FRA(20)] https://blog.naver.com/gdpresent/222452131201 Picking up from the previous post, time to introduce a few more financial ratios… blog.naver.com
Originally written in Korean on my Naver blog (2021-08). Translated to English for gdpark.blog.