Financial Ratios (2): Financial Analysis Techniques
Part 2 of financial ratios — breaking down liquidity ratios like the Current, Quick, Cash, and Defensive Interval ratios with actual intuition, not just exam memorization.
Continuing from the last post, I’m going to keep introducing more financial ratios!
Like I said last time — for exam purposes, the priority is just memorizing them accurately and calculating without slipping up.
Buuut
Studying like that is boring as hell, so I’ll mix in some practical stuff that came up in class~
Let’s get it!!!
Liquidity Ratio: Current Ratio / Quick Ratio / Cash Ratio / Defensive Ratio
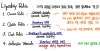
1. The Current Ratio — what we call the liquidity ratio — is just looking at the ratio between assets that can be turned into cash within one year (cash and cash equivalents, quick assets, accounts receivable, inventory, that kind of stuff) versus current liabilities, which are obligations you have to settle within one year.
(It doesn’t strictly have to be within one year, by the way. With accounts receivable, sometimes the counterparty says “I’ll pay you, but the term is over a year!” — but does that mean accounts receivable under one year goes to current assets and accounts receivable over one year goes to non-current? Nope. That’s not how it works. AR has this weird quirk where everything just gets dumped into current… Anyway, vibes-wise, just feel it as: assets that’ll convert to cash soon-ish, and obligations scheduled to be performed soon-ish… heh… that kind of feel.)
2. Quick Ratio. So, “quick assets” basically means current assets minus inventory — that’s how you’d define quick assets.
But hey — when you hear “quick,” some of you might’ve thought of “quick deposit” / “checking deposit” type stuff. That kind of “quick” gets talked about under “cash and cash equivalents.”
I’ll go into that part in more detail when we get to cash and cash equivalents!
Anyway, the Quick Ratio is the perspective of: take Current Assets, kick out inventory (the slowest thing to convert to cash), and then look at the ratio against current liabilities. So it’s a way more, way more, way more, way more conservative version of the Current Ratio. heh heh heh
3. Cash Ratio: literally just cash and basically nothing else. Quick Ratio only kicked out inventory, but Cash Ratio also kicks out Accounts Receivable. So this one’s a much more conservative way to evaluate liquidity. lol lol
Last one — 4. Defensive Interval. What is this?
So actually, with accounts receivable, it’s not like you’re totally helpless waiting for the counterparty company to pay up. If you really, really urgently need cash, you can discount that AR and sell it off to a bank.
The bank evaluates the counterparty company, sets an appropriate discount rate, and takes that AR off your hands.
And then the bank just needs to collect from that client, right????
Anyway, in the Defensive Ratio, you exclude just inventory from current assets and call that your cash-convertible assets,
and the denominator is Average Daily Expenditure.
You stick in the average daily expenses this company burns through, and the financial ratio is asking: “If they couldn’t earn a single cent (had to defend against default purely with those current assets), how many days could they hold out (with the cash-convertible stuff they’ve got piled up)?” heh heh heh
What else should we squint skeptically at here?
Is what’s labeled “convertible to cash within 1 year / obligations to be fulfilled within 1 year” on the financial statements really truly that within 1 year? That’s the question.
Example. Say GD Corp borrowed 1 billion won from a bank. Took it on a 10-year maturity, and somehow 9 of those years have flown by, with 300 million won left.
Maturity day arrives. GD Corp couldn’t pull together the 300 million won……………… So would the bank just immediately declare them bankrupt and let the whole company collapse??????
From the bank’s perspective — forget the principal — a company that seems like it’ll keep paying interest forever is actually a more profitable customer to keep on the books…..
So usually they just refinance the whole thing, apparently…….
And on top of that lol lol lol lol lol lol lol lol lol
More than half of Korean listed companies have a Current Ratio below 1 lol lol lol lol lol lol lol lol lol lol lol lol
What can you do lol lol lol lol lol lol lol lol lol lol lol lol lol lol lol lol
lol lol lol
Hold on, is it actually more than half?? lol lol lol lol

Pulling up the full quarterly financial statement data,
the current ratio comes out around 20% across roughly 2,000 listed companies in Korea heh heh heh
Anyway……. the gap between theory and practice…… yeah, it exists………..heh heh heh
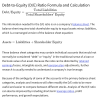
Solvency
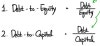
If you crack open a dictionary, “solvency” comes up as something like “ability to pay” — and you can think of this as the name we use when we evaluate long-term liquidity :-) What we’re going to look at: Debt-to-Equity / Debt-to-Capital / Financial Leverage / Interest Coverage / Debt-to-EBITDA. Let’s start with the first two. I get what Equity is, but where exactly are Debt and Capital pointing? I used to wonder whether Debt and Liability were just synonyms — but apparently there’s a slight difference in meaning between those terms.
And I used to wonder if Capital was a synonym for Asset.
The values come out the same,
but apparently there’s a subtle difference in terminology depending on which side you’re speaking from.
But it’s kind of ambiguous.
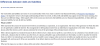
https://connect.informs.org/blogs/james-mellor/2019/06/12/differences-between-debt-and-liabilities
Differences between debt and liabilities — referring to the explanation here, they say the difference between Debt and Liability is Interest.

But if you go look at Investopedia’s page on the formula for Debt-to-Equity,
This is what you get, and it’s ambiguous~ (Because the True leverage value gets distorted by other liability items (Liability rather than Debt)),
other values can be used~
That’s basically how it describes it….
The thing is — these financial items don’t have a single fixed standard definition,
so I think that’s where this problem comes from. It’s stuff that gets used at the analyst’s discretion.
Anyway, just take it as: we’re learning the feel of financial ratios……! heh heh heh
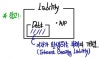
And now — Capital.

Assets, which we say are the rights of the company,
and the side that explains those assets is the credit side on the right — Liability and Equity, meaning what’s owed to creditors / what’s owed to shareholders,
and apparently, when you talk about it from that perspective, you call it Capital. heh heh
OK, let me just say one thing and move on.
Imagine we’re not solving exam problems — we’ve got financial statements laid out and we’re just looking at whether some company is doing okay.
To check the long-term liquidity angle, we want to calculate this value,
and let’s say we plug in Liability (total liabilities) instead of Debt and crunch it out.
Would that produce a completely wrong number and lead to some absurdly idiotic analysis result?????
Nah…. what would that even matter? It’s not like we’re trying to nail down every subtle nuance of that company’s condition through the financial statements anyway,
the point is — Debt or Liability, doesn’t really matter that much……
(Of course, for exam-takers who have to mark the right answer, whether it’s Debt-to-Equity or Liability-to-Equity is very, very important ^^)
So let’s say there’s some company whose debt ratio comes out really, really high.
Does that mean this company is just totally hopeless??????
Picture this — you’re raising money to start your own business.
If it’s a business where success is practically guaranteed, would you take on debt or would you go find a partner (Equity)???
Of course you’d borrow the money. A partner has to share in the profits too, right?
With debt, you just pay the interest, and all the leftover money is yours!!!! That’s how it works.
So in the end, the same lesson applies here too: “It’s hard to judge anything off this one number alone;;” — that’s the takeaway.
In Korea, if a listed company’s debt ratio crosses 200%, the FSS (Financial Supervisory Service) apparently designates an auditor for them.
Investors will say “this company’s dangerous!” once it crosses 200%….
But apparently there are quite a few scholars going “wait, where did that magic number 200 even come from??”
(For the record — Apple’s debt ratio cruises past 200% no problem. If they were listed in Korea, the FSS would’ve flagged them ages ago lol)
Ooh, I gotta check this one time lol lol lol lol
Just like Korea has the DART electronic disclosure system, the US has a site called EDGAR,
and I went and pulled up the most recent AAPL financial statements there.
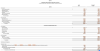
Debt ratio: 413.13% lol lol lol lol lol lol
lol lol lol lol lol lol lol lol lol lol lol lol lol lol lol
In particular — for the airline industry, just because of how the industry works, the debt ratio inevitably blows past around 400% even at its lowest.
(Can’t just skip past that — here’s Korean Air’s financial statements.
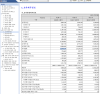
Debt ratio comes out to about 660.63%.)
But then with the recent Asiana Airlines mess, people went “the debt ratio was too high~ oh dear~ this was a dangerous company from the start~”
— but Korean Air is actually a company that presents its financial statements more conservatively than Asiana Airlines does.
(And this kind of thing — lol — suddenly conservative, I dunno, but the company itself looks solid…… the owner…..oops! Stop right there! lol)
Anyway… blaming the Asiana Airlines situation on a high debt ratio is way off from what actually happened……
Their valuation would’ve been lower than Korean Air’s!?!?!? and Korean Air is just over there minding its own business.
In other words — shouldn’t you be factoring in industry characteristics too~?
That was the point. heh heh heh

Number 3 — there’s a moment in Corporate Finance where you learn Operating Leverage and Financial Leverage all in one go,
and that’s when you really feel both of these click together!!! heh heh heh So we’ll deal with it then.
The Corporate Finance logic is way more useful than just memorizing the formula written out flat like that, so we’re skipping #3.
4 is ‘Interest Coverage’ — and this one’s pretty controversial.
First — for CFA exam purposes, just think of EBIT as operating profit. (In real life, data vendors give you EBIT as the same value as operating profit anyway…)
The reason interest payment (interest expense) is controversial — “capitalized borrowing costs.”
When we did P.P.E. in the CFA curriculum, we were told that interest costs incurred while acquiring “construction in progress (CIP)” get added to the PPE side and don’t get recorded as interest expense on the I/S.
(Not all CIP works that way — only assets designated as qualifying assets get interest costs capitalized to assets according to the set rules.)
So even if our company actually spent 50,000 won on interest expense this fiscal year, only 30,000 won might show up on the I/S, and the other 20,000 won could’ve gone in as an addition to CIP under Assets…….
So when you’re looking at the interest coverage ratio, you’ve gotta carefully check whether there’s CIP on the financial statements or not!!! Said this earlier — heh heh heh
(Random thing I picked up here and there — apparently when banks are deciding whether to lend money, the main thing they look at is the interest coverage ratio :-))

We said you can think of EBIT as operating profit — but what’s EBITDA?
EBITDA is EBIT plus D and A. D = Depreciation, A = Amortization. So you add back depreciation and amortization.
To really feel EBITDA, you need to learn the indirect method and direct method of the cash flow statement at the very end,
and I’ll talk about it again then — but let me just give you a quick version here.
As you work your way down to EBIT (operating profit), all kinds of expenses peel off — cost of sales goes out~, depreciation goes out~, SG&A goes out~, and once all those various expenses are deducted, what’s left in EBIT goes to: Interest, which is the creditors’ share / Tax, which is the government’s share / and the rest, which is the shareholders’ share, right?!
But — among those expenses that peeled off, depreciation isn’t actually money that left the company in cash this fiscal year……
There’s some piece of machinery bought 10 years ago for 1 million won, depreciated straight-line so 10,000 won per year shows up as expense, and intangible assets bought 5 years ago… that kind of stuff. None of it actually got spent this year — but we call it expense of this year to satisfy the matching principle of revenues and expenses.
So you add the D and A back in -> and you get a value that can stand in as a rough proxy for cash flows from operating activities.
Apparently credit rating agencies mostly look at the Debt-to-EBITDA value, and the story is — if it goes over 3x, they smack you……heh heh heh
Anyway — you get the concept of what we’re trying to look at, right?!
The idea is to look at the ratio of money this company actually earned in CASH this fiscal year / against its liabilities,
and if you can’t even earn 1/3 of your debt, they go “uh, hey, do you maybe just have no hope?” …… heh heh heh
OK so we’ve now run through turnover ratios / short-term liquidity / long-term liquidity ratios,
and now — last one! The most glorious of all the financial ratios! Profitability ratios!!!! heh heh heh
(Glorious — what do you mean glorious… that’s just a name I made up…..heh heh)
For the profitability ratios, we’re going to look at ratios called XXX Margin. Easy stuff.

Because of this — it’s not hard.
So if you list out the various ratios, here they are:
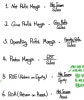
Setting ROE and ROA aside for a sec —
through #4, all of these are things you can settle entirely on the I/S.
Let me type out the orange-colored text here a bit.
CGS: For Korea’s traditional manufacturing industry, they often import and buy raw materials, so CGS gets booked big.
So usually these manufacturing companies don’t post a particularly large Gross Profit.
(For reference — if CGS is written as (12,000), that doesn’t tell you how much went to raw materials, how much to labor, how much to other incidental costs. You’d have to flip to the notes and look at “classification of cost of sales by nature,” where 3 cost components (raw materials, labor, overhead) explain almost 90%… so you’ve gotta do at least that level of analysis ^^~)
SG&A: For your “let’s go! bio!” companies, R&D costs eat up everything here,
and if a “let’s go bio” company’s sales explode, G/P in particular explodes in a huge way (same applies to the gaming industry).
So if you just rank Korean companies by highest G/P with no other classification, the ones showing up are likely bio or gaming companies that had explosive sales…. knowing this stuff helps^^ It’ll let you answer the question: why is your G/P so high?
One more — for cosmetics companies, they don’t run huge R&D and raw material costs aren’t crazy high either, but generally cosmetics companies have advertising costs and distribution costs eating up most of their expenses, so apparently they have this characteristic where G/P comes out high but O/P (Operating Profit) comes out low.
(Since we’re on advertising costs, let me peek at this too — apparently the top 6 in advertising spend in Korea are basically always fixed. Samsung Electronics, LG Electronics, Hyundai Motor, Kia Motors, SKT, Amorepacific.
These companies apparently make up nearly 40% of the revenue of Korea’s advertising market. Just check what ads run right before the 9 o’clock news…. And in Samsung Electronics’ case, apparently they hit exactly about 2% of sales revenue on advertising spend with eerie precision. They’ve gotta be intentionally hitting that mark.
For Amorepacific — they jumped into the top advertising tier relatively recently as a rising force apparently.)
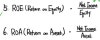
Rambling a bit about ROE and ROA — the concept itself is crystal clear, no mystery.
“For the net income you’re earning — how much net income is that relative to total equity? Or how much are you earning relative to your own money (capital)?” That’s the question.
And for ROE, from the numerator and denominator… you can subtract out the portion that goes to preferred stock —
meaning, knock out from net income what goes to preferred shareholders, and from equity also knock out the preferred stock portion,
and ask: the ROE that strictly drops to common shareholders — what is that?! There’s that flavor of ROE too.
But — for ROE, more than that stuff, you need to know this.

Why the growth rate of net income equals the retention ratio multiplied by ROE.
The reason this lines up as an equation:
Out of net income, the Payment Ratio portion goes out as shareholder dividends, and the retention ratio gets reinvested back, right?
Say dividends were 60%, retention was 40%, and this company’s ROE is 10%.
That reinvested 40% — what does it look like next year?
If the company keeps the same level of ROE, it grows that 40% by another 10%, right????
40% × 10% = 0.4 × 0.1 = 0.04 = 4%

Yeah!!!!! Doesn’t that just click?!?!?!?!?
OK~
PS. Now — here’s something you really gotta watch out for.
Without thinking too hard, you might pop open DART and EDGAR and start looking at financial items,
and yeah, you could also look at the financial items shown on Naver Finance or Daum Finance.
But — what they’re showing you is the primary financial statements,
and if a company uses consolidated financial statements, the primary financial statements are the consolidated ones.
And those consolidated financial statements are written under the premise of merging in the subsidiary companies that fall under consolidation scope…….
So — keep this in mind.
Merger, consolidation, equity method — studying how to lump multiple companies into one and write financial statements on top of that — that’s advanced accounting,
and once you’ve started studying accounting, it really seems like you have to push all the way through to advanced accounting.
More than half of CFA Level 2 accounting is themes from advanced accounting…….heh heh heh
Anyway — to really look at financial items in detail still…… a bit more studying is needed :-)
Let’s go!!!!!!!!!! All the way~~~~~~
Alright, with that, I’m closing out the second story of Financial Analysis Techniques!!!!
Next up is a story about DuPont Analysis,
and that’s gonna be really fun too!?!?!?!?!?
See you again next week!!!!!!!
Originally written in Korean on my Naver blog (2021-08). Translated to English for gdpark.blog.