DuPont Analysis
DuPont Analysis is basically about ripping ROE apart into three pieces — Net Profit Margin, Asset Turnover, and Financial Leverage — so each one actually means something.
What is DuPont Analysis?
So first off — DuPont. That’d be the analysis method that the lighter company came up with, lol.
I don’t really know much about this company but it seems wildly impressive… I heard they’re also the ones who first invented this thing called nylon, heh.
Tangent, but apparently DuPont pulling off the synthesis of nylon was a huge deal scientifically. Like, genuinely historic.
The thing is — back then, engineering did its own engineering thing, and natural science did its own natural science thing. Two separate worlds.
But this nylon thing was the first time natural scientists and engineers actually pulled something off together. And once that wall between natural science and engineering started to crack —
I mean, there’s no way physicists alone could’ve built the nuclear bomb, right???
Anyway, that crack apparently kept widening until eventually it led to building nukes…
OK OK OK OK — DuPont. Hahaha. I started talking about DuPont and immediately wandered off, classic.
OK OK OK OK OK OK OK OK OK OK.
So — DuPont Analysis. What is it actually trying to analyze?
It’s the idea of taking ROE and ripping it apart.
Return on equity?
That’s the right term, right???
Anyway, ROE is a financial ratio that asks: out of the company’s equity — its “net assets” — how much net income did it actually produce this period?
So the formula is dead simple, heh.
It’s just net income divided by total equity. That’s it.
And DuPont Analysis goes: cool, but let’s pull this apart.
Pull it apart how?

Now — if you cancel everything out, you’re back to net income over total equity. Arithmetically, nothing changed. So why bother splitting it?
Because each piece you split it into actually means something on its own.
Means what, though?

We covered financial ratios a while back, remember?
https://blog.naver.com/gdpresent/222460943266
Various Financial Ratios (2) (Financial Analysis Techniques 2) [CFA I Studied #20. FRA(20)] https://blog.naver.com/gdpresent/222452131201 Continuing from the previous post, a time to introduce several financial ratios… blog.naver.com
Since we already went through all this, no need to relitigate each one.
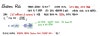
And like the image says — the gist is that “Financial Leverage acts as a lever amplifying swings in Net Profit Margin”, basically.
I think grabbing it at that level of intuition is plenty, heh.
Oh wow — could this actually be a way to filter out genuinely good companies?
I tried building an investment strategy on top of this, hahaha.
But yeah, predictably, leaning on this one thing alone in the real world… bit of a stretch……
Just rambling, heh.
Anyway —
DuPont Analysis: even when you’re looking at ROE, you split it into three pieces — Net Profit Margin / Total Asset Turnover / Financial Leverage —
and use those to filter for higher-quality ROE.
That’s the one-liner.
Let’s run through one example before moving on, yeah?
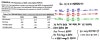
If you just look at this company by ROE:
Year x3: 18.07%
Year x4: 17.98%
Year x5: 17.38%
You’d probably go: oh, a company holding steady around 18% ROE? Solid.
But run DuPont on it, and:
“Asset Turnover is dropping, Net Profit Margin is also dropping, and they’re keeping ROE up by cranking Leverage and dialing up volatility.”
Oh! This is getting risky!!! (Time to bail!)
Yeah — something like that. I dropped this in because it gives you a feel for how the tool actually gets used, heh.
Wow, so clever!
I’m sure tons of people throughout history have looked at this and thought the exact same thing, heh.
And apparently somebody at some point went: hey, can we break this down even further and look closer?
So we also have this thing, heh.
The Extended 5-way DuPont Equation.
It’s a method that looks at ROE through a total of 5 terms — you take the Net Profit Margin piece from before and crack it open one more time into 3 more items.

*EBT: Earnings Before Tax
*EBIT: Earnings Before Interest and Tax
What does each of those new pieces mean?
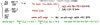
It treats them as 3 items: Tax Burden (the tax retention ratio) / Interest Burden / Operating Profit Margin.
And the whole point of the 5-way Extended version —
I think you could describe it as analyzing the profit side and asking: “Hey — your profit, that margin you ended up with — how much of the burden was taxes and interest?”
That’s it for today, kinda short! heh.
Ahhh, feels good, heh.
So — what are we doing starting next time?
What we’ve covered so far from the financial statements —
Inventory / tangible assets / bonds.
About that much, right? But there are way more account titles in the financials, you know?????
We’re going to look at the account titles we haven’t covered yet,
but not in the deep-dive way we did inventory or tangible assets —
we’ll skim through them lightly,
lightly look at what a statement of changes in equity is, what total comprehensive income means —
light, light, light skim through the whole batch.
And our final boss will be the “cash flow statement”!!!!
Anyway — that’s the heads-up on where we’re heading from here.
I’ll leave you with one photo that needs no explanation, and I’ll be back next week~~~~
Bye bye bye bye.
Originally written in Korean on my Naver blog (2021-08). Translated to English for gdpark.blog.