Cash Flow Statement and EBITDA
Working through a real B/S and I/S to build a Cash Flow Statement step by step — tagging every line item as O, I, or F and smashing out CFI, CFF, and CFO the direct way.
Picking up right where I left off in the previous post.
https://blog.naver.com/gdpresent/222533554155
Cash Flow Statement [My CFA Study #25. FRA(25)] — and we’re FINALLY at the tail end of FRA!!! The fact that we get to talk about the cash flow statement at all is wild!!!! In financial statements, the financial sta… blog.naver.com
At the very end of that post, I laid out the recipe for putting together a Cash Flow Statement.
From the given B/S and I/S, take every line item and tag it as O, I, or F.
Smash out CFI and CFF using the direct method.
Smash out CFO using either the direct method or the indirect method.
So now we need a B/S and an I/S to actually work with,
and I’m about to throw one at you!
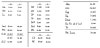
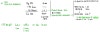
Given a B/S and I/S that look like this,
and assuming we’re under US-GAAP,
- If we tag each item as O, I, or F,
For now, the stuff highlighted in purple is the conclusion we’re heading toward.
Cash went from 9,500 to 33,000, and we’re going to figure out exactly what made it move~
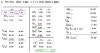
On the fixed asset side — Land, P.P.E, (A.D), G.W — those guys all belong to Investing activities……
This is one of those things that… no matter what… you just have to memorize… but since these financial statements are so simple, it doesn’t really feel hard…. heh heh
AD: Accumulated Depreciation
GW: Good Will <- Looks like they acquired something. And that’s the intangible asset that landed on the books~
Over on the Financing side,
Dividend Payable under US-GAAP is an F activity,
and the bond and stock issuance pieces are obviously F activities,
but Retained Earnings is a little ambiguous.
The R/E side requires you to look at all of it together — how much the company earned this period (Net Income), how much got distributed as dividends (Dividend), and what the ending Retained Earnings ends up being…..
R/E already has its own dedicated little template for analysis, you see….
So for now, the point is — I just dumped it under F anyway!!! (Not important!)
OK so step 1 said classify everything,
and since everything’s classified, let’s roll into step 2!
- Smash out CFI and CFF using the direct method!

Alright, let’s start smashing them one by one — kicking off with the most representative one, P.P.E, using the direct method!
(Instead of writing out in words how to smash with the direct method first and then doing it, just by watching how it unfolds,
you’ll get what “smash with the direct method” means!? For now, I think one look at it should be enough!)
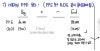
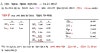
So the basic analysis template looks like this!
What was at the beginning, what went in, what went out, what we ended up with at the end.
The beginning (last year’s ending B/S) and the ending values come straight from the B/S — written in black,
and since this year’s depreciation expense from the I/S gets piled onto accumulated depreciation on the B/S, the I/S info is written in gray.
From here, we just trace through the remaining empty cells one by one and the entire P.P.E story falls into place,
so let’s trace it out!
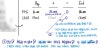
For now, there was no event that would have decreased accumulated depreciation. (There could be one if a fixed asset got disposed of.)
Since accumulated depreciation didn’t decrease, there’s also no occasion for PPE to swing negative either!
Wait WHAT?!?!?!?!?!?! The ending fixed asset value is 85,000?!!??!?! Ohhh, so we can confirm 25,000 of PPE got picked up this year!!!!
(There’s a chance it was bought on credit… they’d use an account called accounts payable for that… phew,,, there isn’t one, there isn’t. lol But — would the CFA exam even ask something this granular…? It wouldn’t, right…?!)

The remaining 2 don’t have account items that need to be looked at as a pair, so they wrap up nice and clean.
And just like that, all CFI analysis is done.
Cash inflow from Investing activities is 15,000, cash outflow is 25,000.
So our cash flow from investing activities lands at (10,000)!!
OK now let’s hop over to Financing activities!

This is the chunk we said we’d look at!
Let’s hit them one by one!

For bonds — sure, they could go up via new issuances,
but if a discount bond was issued, the amortized cost would also be slowly, slowly creeping up too, right?!?!
https://blog.naver.com/gdpresent/222418753867
Complete Understanding of Effective Interest Method Accounting [My CFA Study #15. FRA(15)] The original plan for this post was to write about ‘Non-Current Liability’. A little… blog.naver.com
I went into truly painful detail on the effective interest method back here!
But — I don’t think there’s ever been an exam question that actually requires you to factor in the gradual rise in Bond BV from the effective interest method….
For CFA exam purposes, a change in Bond BV is most likely a new issuance!
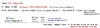
And we need to look at Dividend Payable,
and the dividend piece needs to be looked at jointly with Net Income and Retained Earnings,
and the way to look at it is,
Pretty simple, right.
Net Income gets added to beginning retained earnings, and however much dividend was declared gets logged as Dividend Payable,
so it’s basically a solve-for-x game with a first-degree equation.
But there’s also the question of whether the amount logged as Dividend Payable actually went out as cash — and that’s a piece we have to think about too.
Once we understand the situation where D/P — meaning “money promised to be paid as dividend” — has changed,
we can work out that the actual cash that went out as dividends this year is 3,500,
and getting THIS part really, really, really, really nailed down right now is going to make life way easier when we tackle the indirect method later!!
But — even if you get it here and still find it a bit fuzzy, that’s fine.
Once you study the indirect method, you’ll get all of it anyway ^.^
Anyway, CFF analysis — also done.
Step 2 is officially complete.
Now I guess it’s time to head into the long-awaited step 3.
The conclusion so far was a cash outflow of (18,500),
and at the very start we already peeked at the answer key and we knew there’d be a cash inflow of 23,500.
So the CFO conclusion absolutely has to be a cash inflow of 42,000!!!!
For now, we’ll try this with the direct method first,
and the direct method is what we’ve been doing all along, so it won’t be hard!!!!!
Just do exactly what we did before.

Wouldn’t it be magical if the sales number on the I/S could just represent the entire amount that came in as cash.
But since companies typically transact on credit way more often,
to figure out how much of sales actually came in as cash, you have no choice but to back it out using the credit sales info.
So we wrote the formula as Cash = Sales − ∆A/R,
(This part you really need to internalize! It carries straight through to the indirect method:-))

Since the amount that left as expense for CGS would be the amount that flowed out as cash, we’re saying — OK, let’s analyze this part,
CGS is something that gets recognized under the matching principle only for “inventory that actually got sold,”
so it has to be analyzed together with inventory,
And when securing that inventory, we may have bought it on credit, right?
In other words, there’s inventory that increased without using cash, so to factor that in too, Accounts Payable also has to be considered.
So in the end, we wrote the formula as Cash = −CGS − ∆Inventories + ∆AccountPayable,
and ideally you understand it logically, but………….
As a way to just memorize it easily….

(But blind formula memorization without principle is always dangerous, so it really matters that you feel in your gut why that formula makes sense. T_T)
(Sorry, that was a comment from a nerdy physics major. T_T T_T T_T lol lol lol lol lol lol lol lol The trait that all physics people share is…. they will absolutely never memorize a formula….lol lol lol lol lol lol lol lol)
Anyway, since we’ve got the principle down,
the rest should wrap up easily.

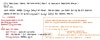
Cash = (I/S item adjustments) + (changes in related Liability accounts) − (changes in related Asset accounts)
Computing with this formula is super convenient,
and as long as you correctly identify which related accounts you’ve been handed,
calculating cash inflow/outflow honestly doesn’t seem hard anymore.
But hold on — looking at the CFO side,
every CFO-related account item
runs through this one formula:
Cash = (I/S item adjustments) + (changes in related Liability accounts) − (changes in related Asset accounts)
Doesn’t that mean we could just do all of it in one shot?!?!?!?!?!?
Can’t we just blast through it in a single move??????
Yep. Exactly.
The thing that processes it all in one shot is — drumroll — the indirect method CFO cash flow statement.
For now, just pretend Net Income is entirely CFO.
What kind of nonsense is THAT!?!?
Net income clearly has stuff mixed into it that affects CFI and CFF too, doesn’t it?!?!?!?!?!?
Yes yes yes yes yes yes, you’re right.
So the things in net income that affect CFI or CFF — we offset them back out.
Then once we’ve offset them back out like that,
“profit and loss from operating activities” pops out.
And we already learned this when we did the direct method earlier.
That the amount the period’s profit and loss moves things by doesn’t all come in or go out as cash.
Whether it’s because of credit transactions, or because the cash inflow or outflow gets delayed or sped up for other reasons, by exactly that amount,
an asset or liability item on the B/S gets created,
and we have to factor that in too to actually know how much cash came and went.
So if we factor in changes in operating-related assets and liabilities on top of that, that’s our cash flow from operating activities.

Goooooooooooooooooosebumps!!!! — nope, no goosebumps lol lol it’s an obvious result lol lol lol lol lol lol
Why?
Because there’s literally no reason the calculation above
should differ from the direct method we just did. heh heh heh heh

There’s no way they’d differ…….heh heh heh
Alright then,
let’s wrap up the cash flow statement.
We said that if CFO is disclosed using the direct method, you ALSO have to write it out in the notes using the indirect method, right???
(Of course, folks who disclosed via the indirect method don’t need to add a direct-method version in the notes.)
Why….. do they make you do that?
As I mentioned earlier,
the cash flow statement was meant to show the quality of earnings,
and the reasoning is probably that the indirect method, more than the direct method, is thought to give you more info about that, right?
Changes in operating-related assets and liabilities (in a narrower sense, Working Capital) are the core of what “quality of earnings” means,
A decrease in Working Capital pushing CFO up can be a kind of warning flare.
Because it’s hard to see that as sustainable earnings!
Classic example — operating profit < CFO is normal, but operating profit > CFO means,
operating profit got generated, but the cash never came in….
A/R ↑ … the chance of not collecting it goes up / Inv ↑ … it might get obsolete.. ☞ These could come back as a storm of future losses
stuff like this is also a suspicious sign that drags down earnings quality!!!
On EBITDA
Now now now now now now now now. Now we can finally talk a little about EBITDA.
Say EBIT is operating profit. Inside it sits Depreciation & Amortization, which isn’t actually an expense that left as cash.
Since it’s an amount that didn’t actually leave the building, but already pulled operating profit down,
let’s add D&A back to EBIT.

Not much different, right????
In the end, EBITDA showed up as a concept that says — let’s just roughly pretend changes in operating-related assets and liabilities are zero, and treat it as a proxy for CFO.
(The history of cash flow statements being included in financial statements isn’t actually that long, and apparently in the truly distant past, people used EBITDA to roughly estimate CFO.)
But Mr. Warren Buffett says — please, do NOT look at a company with big swings in Working Capital using EBITDA….
He says the change in W.C is an extremely extremely extremely important item, and apparently he absolutely despises the EBITDA figure for glossing over exactly that.
But hold on — how can you just roughly assume changes in operating-related assets and liabilities are zero and use that as a CFO proxy????
Isn’t that way too big a leap!!!?!?!?!?!?!?
Fair question,
and the big three of operating-related asset and liability changes are A/R, Inv, and A/P,
and since companies basically never just walk in and pay cash on the spot for inventory, Inv and A/P generally move in similar directions, and since one’s an asset and one’s a liability they cancel in opposite directions, so if we say Inv and A/P among the big three just bash heads and die together,
the key one left is A/R,
and for A/R, companies normally try to keep it in a stable state,
so apparently companies run this kind of company policy of maintaining it through receivables management,
and so the move of roughly assuming changes in operating-related assets and liabilities are zero and looking at EBITDA as a rough cut
might not actually be such a wild, far-fetched claim….
And once you study Level 2, you’ll also hear that in practice EBITDA actually gets used a LOT for Valuation…… heh heh heh
Whoa, the cash flow statement is DONE!
Woooooooooooooooo!
After this, the plan is to actually wrap up FRA in about one more post’s worth!!!!
FRA — you’ve worked hard all this time~
What subject should I tackle next……?
What would be fun??????
The remaining subjects are also ridiculously fun lol lol lol lol lol lol lol heh heh heh heh heh heh heh
lol finance is fuuuuuuuuuuuun~~~
Originally written in Korean on my Naver blog (2021-10). Translated to English for gdpark.blog.