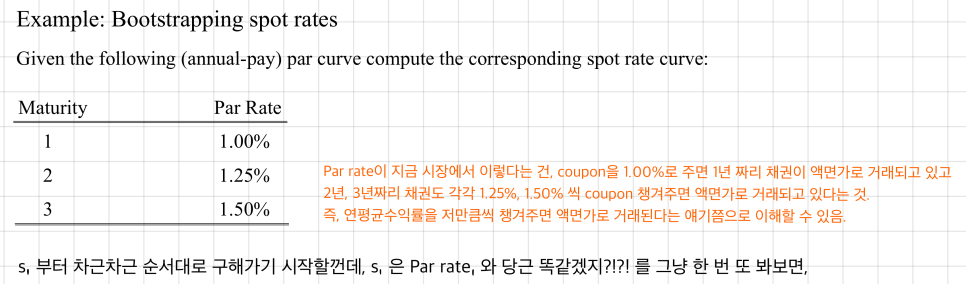
Par Rate
Par rate is just the YTM of a bond trading at face value — and once you get that, bootstrapping spot rates from the par curve is honestly just arithmetic.
Par Rate.
I skipped this in Level 1 — figured “eh, it’s basically YTM, just learn YTM and move on.” But Level 2 asks about it constantly, so… no skipping this time (T_T).
Honestly though, there’s not much to it.
What is Par Rate?
The YTM of a bond trading at face value — that’s the “Par Rate."
OK so — would a zero-coupon bond ever trade at face value? Pretty much never, except in really weird edge cases. That basically doesn’t happen.
So among coupon-paying bonds, the one trading at par is the one whose coupon happens to match exactly what the market is demanding as a yield.
Which means: the Par rate is technically a coupon rate, but specifically the coupon rate that equals the market’s required rate of return.
And that coupon rate ends up being the YTM.
So Par rate = that bond’s coupon rate = that bond’s YTM. All the same number.
Generally, par curve refers to the par rates for government or benchmark bonds.
So this isn’t talking about your everyday corporate bond — it’s built off Government / Benchmark Bonds, the more “fundamental” stuff.
And then —
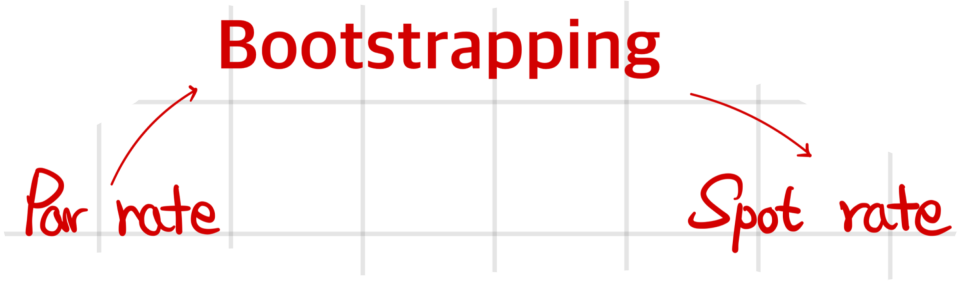
By using a process called ‘Bootstrapping’, spot rates or zero-coupon rates can be derived from the par curve.
The method for backing out spot rates from the Par Curve is called bootstrapping. Honestly, the fastest way to learn this is to just walk through an example, so let’s do that.
- Bootstrapping: the name comes from lacing up shoes — you go through each hole one by one, in order, repeating the same little move over and over. That’s basically what we’re doing: pulling spot rates out of par rates one at a time, in order. Same vibe as threading the laces.
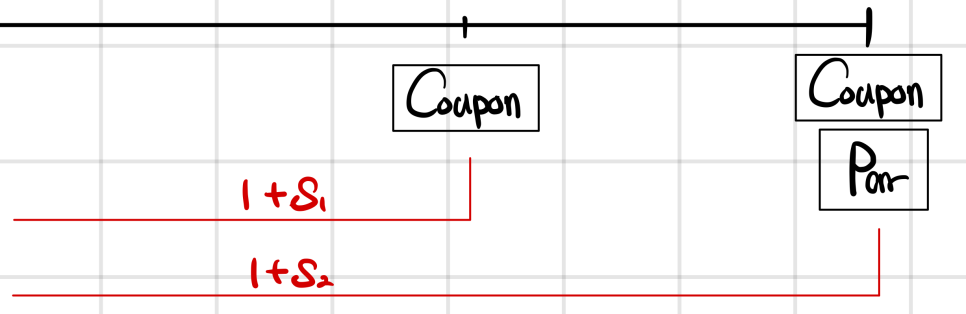
OK, let’s think about a 1Y zero-coupon bond whose face value is Par + coupon.
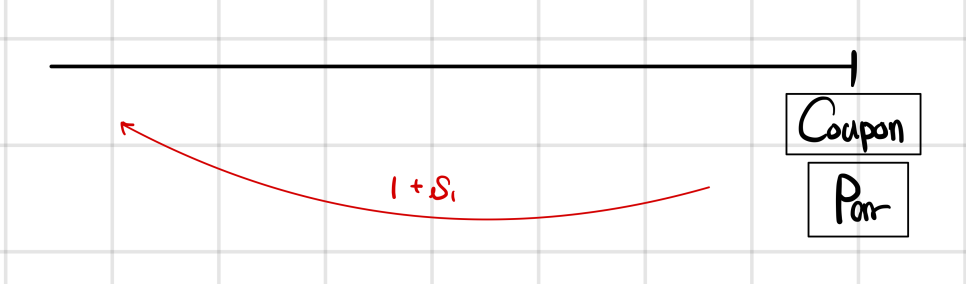
It’s kind of a sneaky setup lol — yes, technically it’s a zero-coupon bond, lol.
Anyway — when we discount this back by $(1 + s_1)$, what does $s_1$ have to be for the present value to come out to face value?
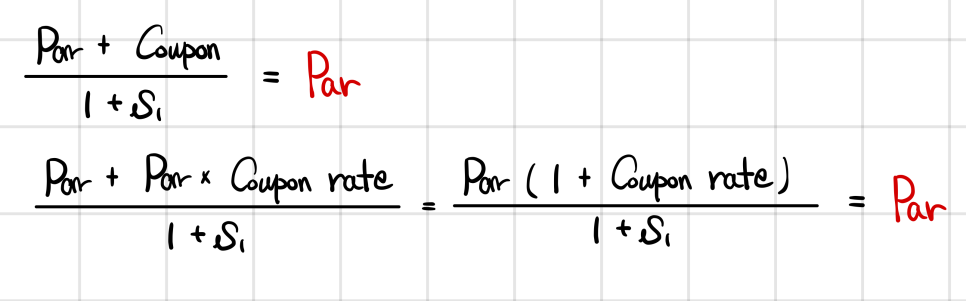
$s_1$ = coupon rate. That’s it!!!
Now $s_2$.
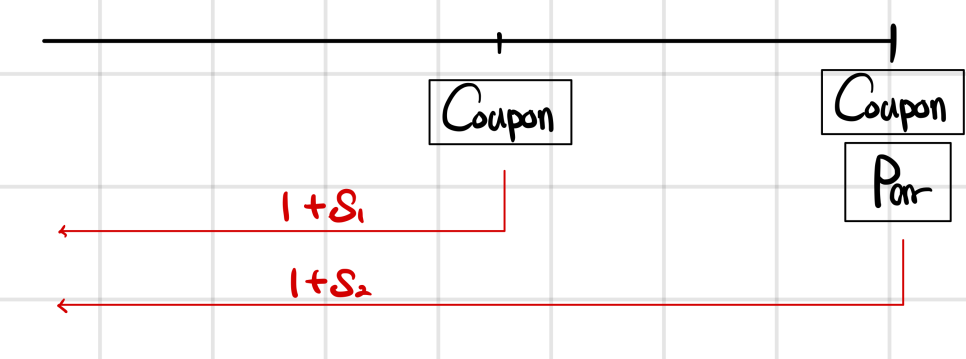
For the 2-year cash flows, we discount each year separately — year 1 by $s_1$, year 2 by $s_2$.
We’re given $c = 1.25\%$ and $s_1 = 1.00\%$,
so finding the $s_2$ that makes $\text{PV} = \text{Par}$ is just arithmetic at this point.
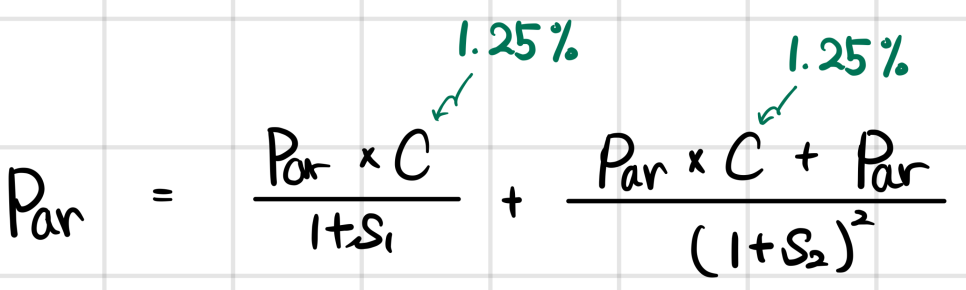
Punch it into the calculator —
$s_2 = 1.252\%$.
And $s_3$ after that? Same deal. Just arithmetic.
So if you’re handed the Par Curve, you can extract every single spot rate.
(Which makes sense — the Par Curve is just the annualized return the market is demanding, so it’s basically the same thing as being handed YTMs.)
The whole thing we just did —
that’s bootstrapping~
One more thing.
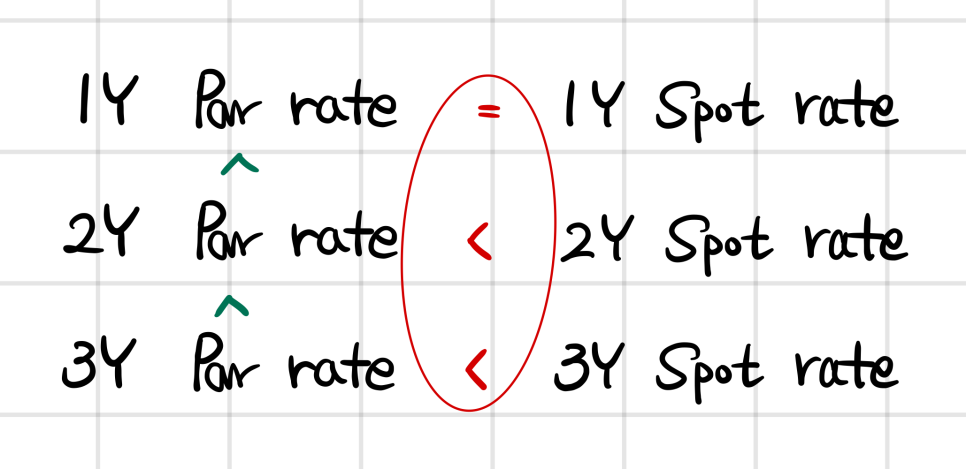
We had 1Y Par Rate < 2Y Par Rate,
and $s_1$ = 1Y Par Rate.
Then $s_2$ has to be greater than the 2Y Par Rate.
Has to be — otherwise PV won’t equal Par.
And the same goes for 3Y.
3Y Par Rate < 3Y Spot Rate has to hold
for Present Value = Par Value to work out.
So in bootstrapping, Par and Spot have this relationship.
(Of course — this only goes this direction because we assumed an upward-sloping curve where 1Y Par < 2Y Par < 3Y Par.)
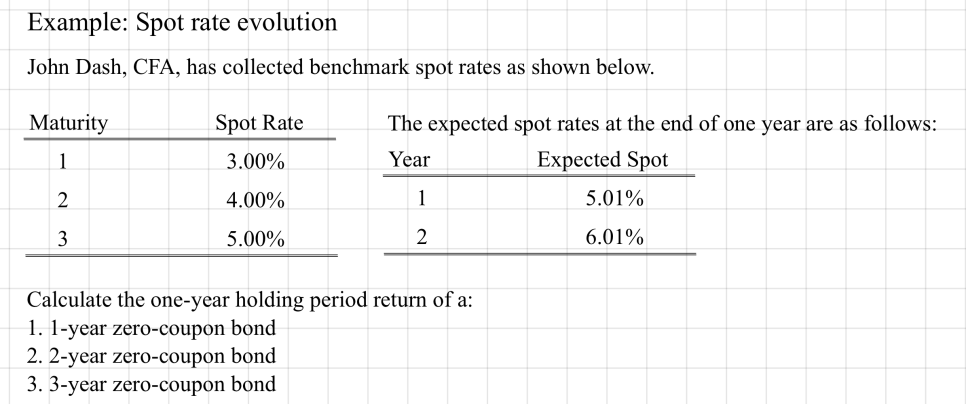
Describe the assumption concerning the evolution of spot rates in relation to forward rates implicit in active bond portfolio management.
An Active Bond Portfolio manager — that’s someone who (actively, hence the name) forecasts where rates are going, takes positions, and tries to squeeze out alpha. They’re not buying-and-holding to maturity. They’re trading in and out based on their view.
First step for them: take the spot rates the market gives you, compute the implicit forward rates.
Then, fundamentally, they’re betting that $s'_i \neq$ implicit forward rate. And they take a position based on that view.
($s'_i$: the actual spot rate when that future period rolls around.)
Want me to ramble on this a little more concretely? OK.
Forward Price Evolution.
At t = 0, the market shows you a bunch of spot rates,
and from those you can derive the implicit forward rates.
If future spot rates actually evolve exactly as the forward curve predicted, the forward price stays unchanged.
That’s the price of a 3Y ZCB at t = 0.
You could also do a derivative transaction on what the price will be 1 year from now —
basically the current market is saying “this is the fair price 1 year out."
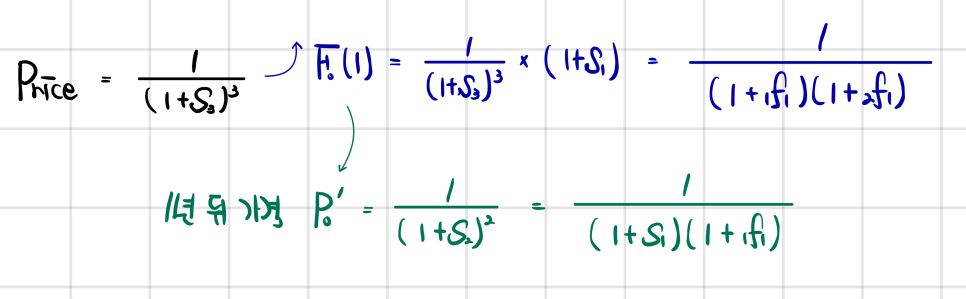
In reality though, once that 1 year passes, the bond becomes a ZCB with 2 years left,
and it’ll get priced using whatever spot rates the market is actually showing 1 year from now.
If the rates we’d seen a year ago all held up, the price wouldn’t have moved.
That’s what the green line is saying.

The exam loves this kind of word-puzzle relationship, so you’ve gotta drill it!!
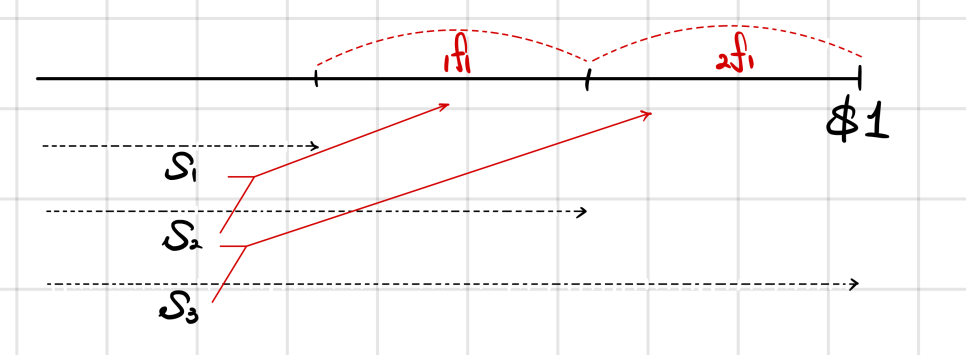
Drawing the problem out as a diagram —
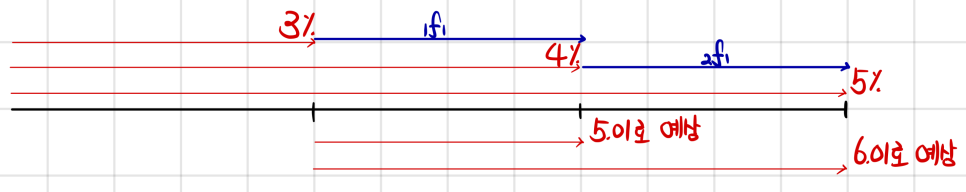
— this is the setup.
And computing those forward rates is straightforward,
wait — what the problem calls “Expected” is literally just the implicit forward rate;;
Anyway, the actual question is the 1-year holding period return.
Hold on — they want the 1-year holding period return without even telling us what the world looks like 1 year from now??
If the future plays out exactly as expected (i.e., the forward curve was right), obviously any bond is going to earn $s_1$ = 3%.
Because $1f1$ and $2f1$ were derived under that exact premise…
It’s tautological. Which is why the textbook just states it:
Hence, regardless of the maturity of the bond, the holding period return will be the one-year spot rate if the spot rates evolve consistent with the forward curve.
OK, here’s a question.
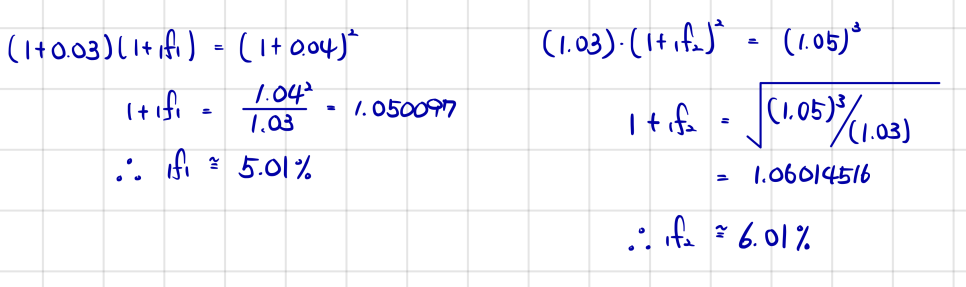
In this same setup — say a manager thinks $1f1 = 5.01\%$ is too high, and they believe the actual 1-year spot rate 1 year out will be 4.50%.
Does this manager think the current 2-year ZCB is over-valued or under-valued?
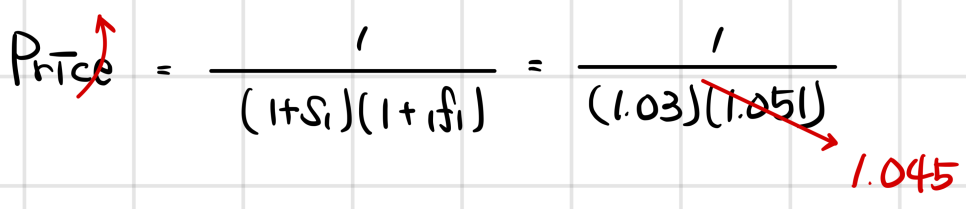
The formula says they think the price should be discounted at 1.045 instead of 1.0501 — so they think the price should be higher than what the market is showing.
Which means they see it as under-valued (under-priced)!!
So what does this person do at t = 0?
A year from now, they’ll be selling at a higher price (discounted at 4.50%) instead of the price implied by 5.01%.
So go long now — buy at t = 0, sell at t = 1, and you pocket more than 3%.
Boring, right???
Please hang in there just a bit longer.
The Fixed Income content for Level 2
actually starts from Chapter 2~
Originally written in Korean on my Naver blog (2024-11). Translated to English for gdpark.blog.
Comments
Discussion happens via GitHub Discussions. You'll need a GitHub account to comment.