Yield Curve Risks and Economic Factors (Nelson-Siegel Model)
Why effective duration falls flat for non-parallel yield curve shifts — and how key rate duration and the Nelson-Siegel model actually fix that.
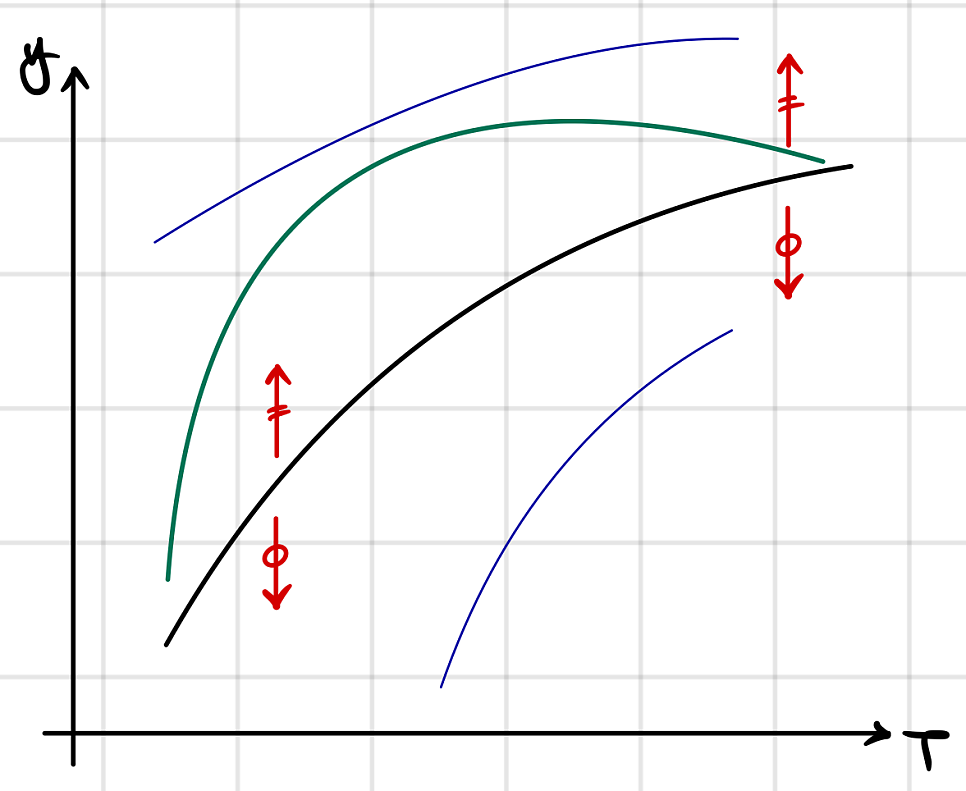
So this whole thing is about yield curve shapes changing — meaning we’re talking non-parallel shift risk!
Yield curve risk is just the risk to a bond portfolio’s value when the yield curve moves in some unexpected way. And how that shows up in the bonds!
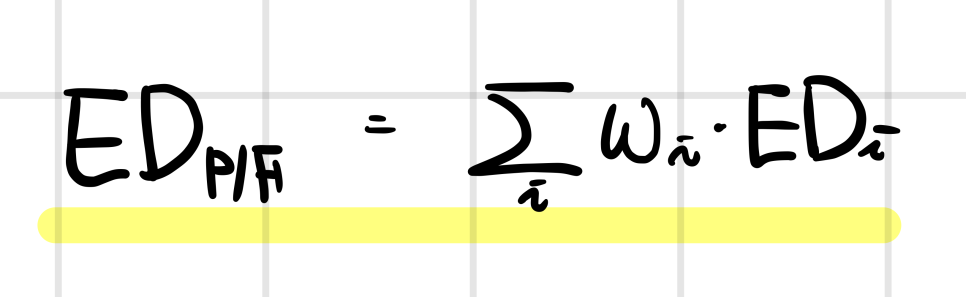
The go-to sensitivity measure is effective duration. I take each bond in my portfolio, compute its ED, weight by the investment weights, and boom — portfolio ED.
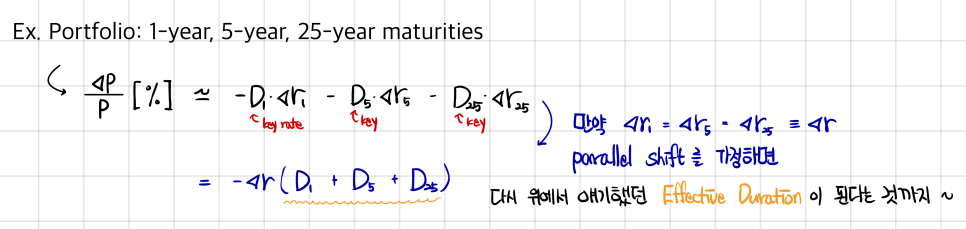
But here’s the snag — the size of the price movement for bond A vs bond B is not gonna be the same in real life,
and the formula is built like they ARE the same.
It’s quietly assuming everyone gets hit with the same ΔYTM. (Same ΔYTM ⇔ the YTM curve shifts in parallel.)
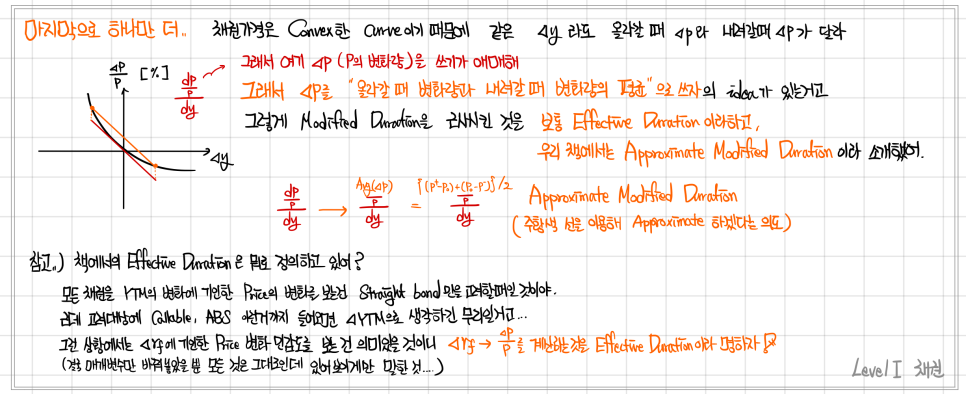
We already saw this back in Level 1 — effective duration quantifies risk assuming the yield curve shifts in parallel…
…but obviously they’re never actually gonna be equal! So the drawback of ED is:
It is important to note that effective duration is not an accurate measure of interest rate sensitivity to non-parallel shift
in the yield curve like those described by shaping risks (yield curve risks)
The book doesn’t actually pin down a definition of effective duration here, so it’s a little fuzzy which duration we’re talking about, but going off the Level 1 explanation it goes like this — (the real deep dive on duration is in Chapter 3 anyway.)
So one sensitivity measure that fixes this is Key Rate Duration!! (In Level 1 they basically just dropped the term and ran.)
Compared to effective duration, key rate duration is superior for measuring the impact of non-parallel yield curve shifts. Key rate duration is the sensitivity of the value of a security or a bond portfolio to changes in single par rate, holding all other par rates constant.
Conceptually:
Hold bond A’s YTM fixed — how sensitively does the portfolio’s value move when bond B’s YTM moves?
Hold bond B’s YTM fixed — how sensitively does the portfolio’s value move when bond A’s YTM moves?
That’s the kind of one-rate-at-a-time approach KRD is taking.
So the way it actually gets written out:
YTM of a 1-year bond moves → how does the portfolio’s value move? → 1-year key rate duration
YTM of an n-year bond moves → how does the portfolio’s value move? → n-year key rate duration
That kind of deal.
Of course, KRD is also Chapter 3 material!! More detail when we get there, so for now just consider it formally introduced!!
Sensitivity to Parallel, Steepness, and Curvature Movements
A different angle — classify the typical shapes a yield curve takes, and quantify the shape itself.. something like that.
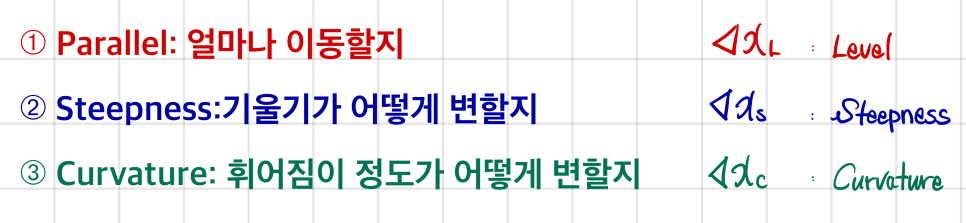
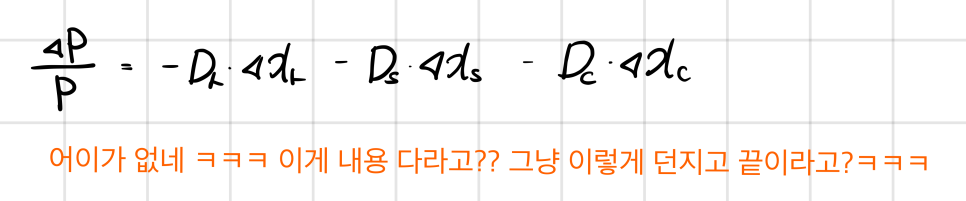
These three are the 3 factors,
and if you can express numerically how much your portfolio gets hit by each one, you’ve got something you can actually manage.
Wait!!!!
Quick side rant!!!!
There’s actually a model that takes those three as factors.
You know how for equities there’s the Fama-French 3-Factor Model — market / size / value?
For bonds, there’s the Nelson-Siegel Model — Level / Steepness / Curvature.
Honestly, I only know NS exists thanks to a friend who works on the bond management side,
and what that friend recommended was none other than….
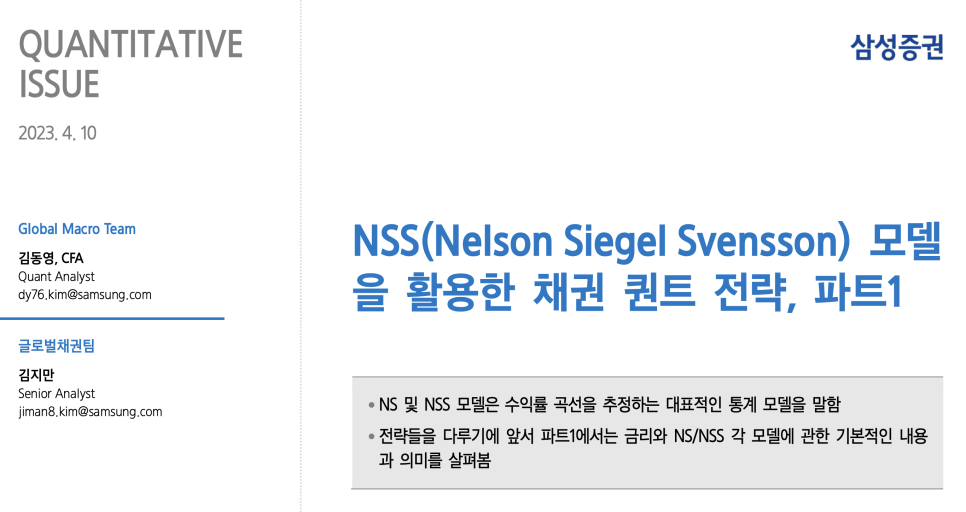
Samsung Securities’ Kim Dong-young……… oh man……
Wait no, Professor of Quantitative Studies haha
There is literally no corner of quant this guy doesn’t cover ugh
As you can see by looking at it,
strictly speaking it’s not Level / Steepness / Curvature, it’s written as Level / Slope / Hump,
but slope = steepness and hump can be read as curvature, so whatever, same thing.
Of course, when you actually try it the optimization is not a piece of cake (same goes for Fama-French) lol
Cuz I’m not an econometrician lol lol
I just train those 3 factors with deep learning,
Anyway — CFA really doesn’t make you study useless stuff lol.
The moment that friend shared Professor Kim Dong-young’s paper with me,
this exact chunk of Level 2 popped straight into my head lol.
Side rant over!
Another thing that can push the yield curve’s shape around: supply and demand.
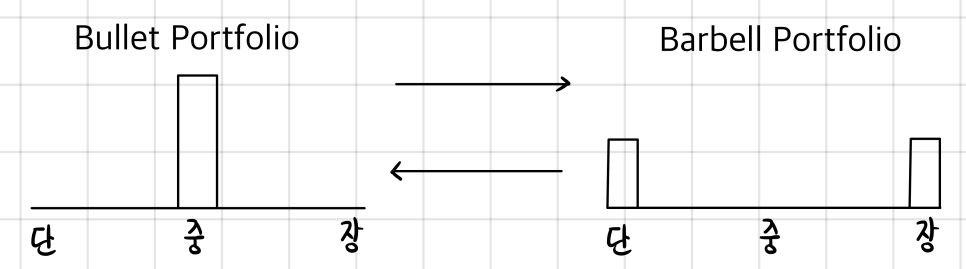
So — Investor Actions!!!
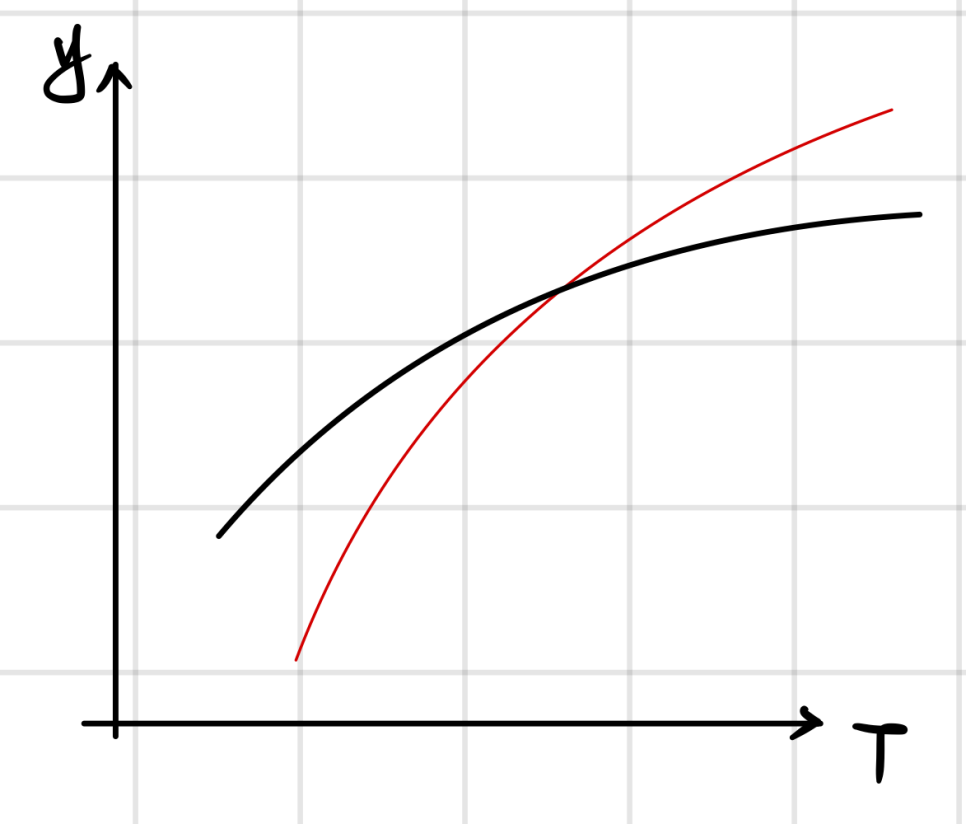
If people expect steepening going forward, they’ll go Long short-term bonds / Short long-term bonds → that kind of move can shift the curve
But regular investors can’t really go Short, can they..?
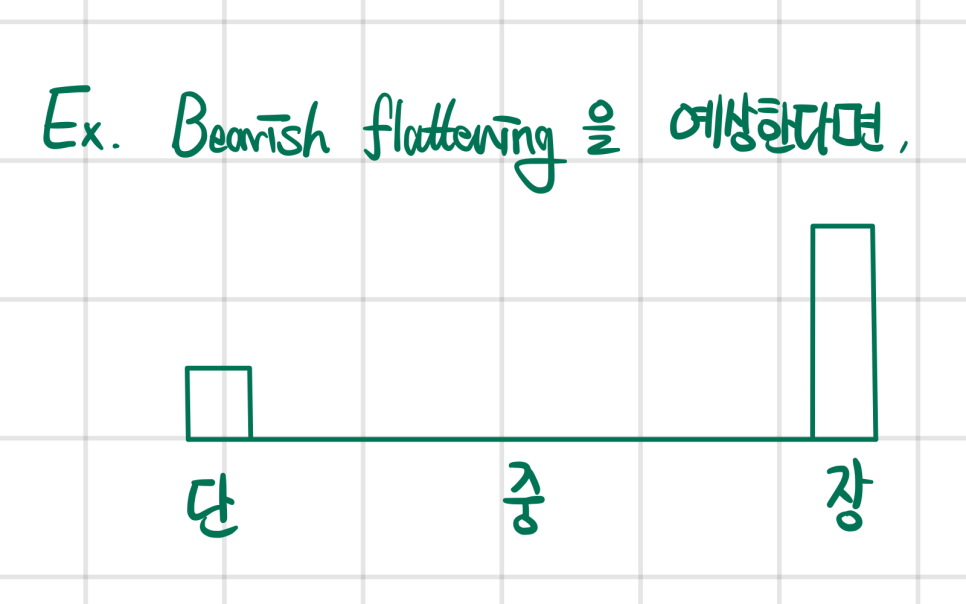
When that’s the case, investors…
…do it kinda like this…
Originally written in Korean on my Naver blog (2024-11). Translated to English for gdpark.blog.
Comments
Discussion happens via GitHub Discussions. You'll need a GitHub account to comment.