Risk and Project Selection: Dominance Principle and Return-Risk Indifference Curves
A chill walkthrough of how risk is actually just quantified volatility — using probability distributions, expected returns, and variance to figure out which projects are worth picking.
The meaning of risk!!
Decisions related to financial management or investment are usually made in situations where the future is uncertain.
When we say the future is uncertain, it means things like how much a stock price will be in the future, or what the results will be after a facility investment…
Nobody knows this stuff in advance, right?????
There might be someone lolol Laplace’s demon lolol
Try searching for it hehehe it’s interesting
Anyway though, there are some things about the future that are certain
For example, the interest (or rate of return) on installment savings or deposits — things like that can be considered (pretty much) certain futures.
So what I’m trying to say is
Risk is a value related to ‘volatility’
No wait, the value related to volatility
you can think of as a quantified number representing risk
So how do we quantify this volatility-related value that represents risk?
By constructing a probability distribution….
Aaaaah so what I mean is, we assume a probability distribution for situations that might happen in the future,
write down the expected rate of return we can get in each situation,
and we can quantify the expected rate of return,
and then the volatility of that,
that is, the variance and standard deviation — that’s what we’re going to call “risk”
Ah then first, we need to know how to write a probability distribution table for what probability each situation occurs at
But actually, writing up a probability distribution table that’s so objective that everyone agrees with it.
Or that would shut up anyone who disagrees — that’s not possible…
Because every individual’s expectation or anticipation about the future is different…
That is, the probability distribution table can only be “subjective”.
Okay so anyway, how do we write up the probability distribution subjectively (as objectively as possible)….
It’s actually super simple… (called scenario analysis)
Future situation
Probability
Boom
0.3
Status quo
0.3
Recession
0.4
Done@@@@ This is the probability distribution

we can just call it this~~~
The probability distribution has to satisfy the definition ’the sum of all probabilities is 1'
Look at the probability distribution table above.
0.3+0.3+0.4 = 1, it satisfies it right?~
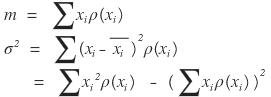
Now that we have this, we can use the definitions of mean (m) and variance (σ^2) as they are
You learn this stuff in high school stats class~
Then now, for each of those situations,
how will x turn out.
You just construct scenarios and lay them out
For example,
G company’s stock return and D company’s stock return — how much in a boom, how much in status quo, how much in a recession
Let’s say the return forecast (as objective as possible, but with some subjectivity mixed in…)
is written up like this
Probability
G company stock return
D company stock return
Boom
0.3
0.3
0,2
Status quo
0.3
0.1
0.12
Recession
0.4
-0.05
0.1
If those returns are expected,
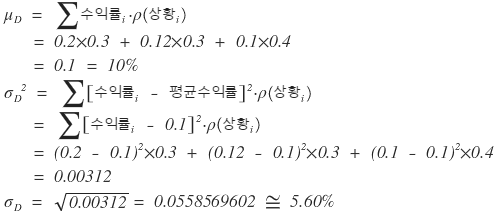
we can calculate the mean and variance for G and D company’s future stock returns according to the definitions!
(For variance, I’ll use the ‘mean of squared deviations’.)
(For the mean of returns (expected return), I’ll write μ.)
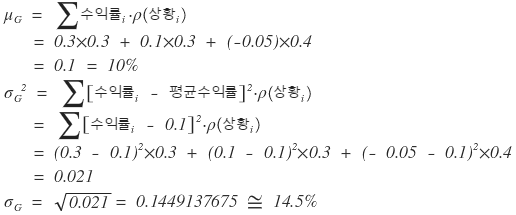
Aaah what this means now is,
whether it’s G company’s stock or D company’s stock, the expected return is the same at 10%,
but the possibility of being far from the mean is bigger for G company.
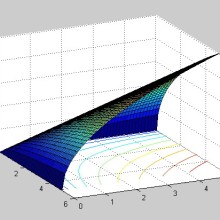
Using high school statistics concepts, based on this information,
if I just sketch the Gaussian Distribution roughly so we can just get a sense of relative position,
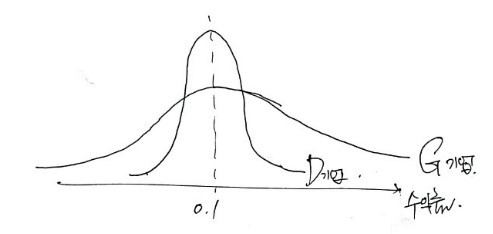
it’d be something like this
For D company, we can almost certainly expect a return of 10%,
and for G company, the possibility is so scattered that we can’t really say,
but on average it’ll be 10% and the possibility of deviating from that is bigger than D company~!!!~~
That’s how we’d interpret it~
So should people buy G company’s stock? Or D company’s stock?????
Which stock can be considered more superior???????
Since the expected return is the same at 10%, but the risk is smaller, D company’s stock can be considered more superior.
If the same return is expected, why would you need to choose G company’s stock with the bigger risk~ that’s what I’m saying.
Right now we can say this because the expected returns are the same,
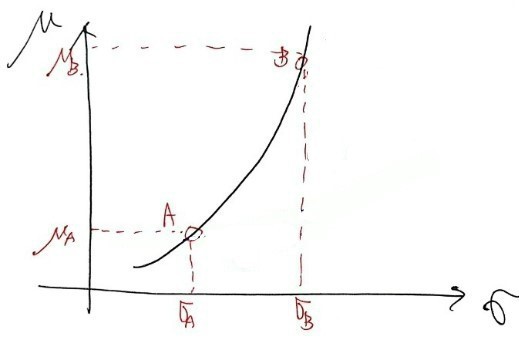
but when does a problem arise

If you face a situation like this, it’s hard to choose.
Company B’s stock has bigger risk, but the expected return is bigger
and Company A’s stock has lower risk, but the expected return is also lower…
Ugh… what am I supposed to pick~~~
Can we even say which one is better????
It turns into this…T_T
The clear answer to this is
“person by person” (sabasa: saram by saram) — that’s the answer.
Because each person’s “utility” is different,
the utility an individual feels for a specific return and risk (standard deviation) is different.
So now here we have to introduce the indifference curve that’s used in economics.
(Here, after introducing the formula of the utility function for return-risk, rather than going quantitative, I’ll just understand the concept qualitatively and move on.)
Let’s say people are largely split into 2 groups.
People who absolutely hate risk
and people who enjoy high-risk, high-return
Let’s say they’re divided into these two groups
The person who absolutely hates risk probably wouldn’t even do gambling even if they were paid to do it
and in the example above, would probably prefer Company A over Company B.
Because they absolutely hate risk, cuz they’d say something like~
“Hey, Company B might pay more, but isn’t there a high chance of l.o.s.i.n.g it??? I don’t wanna I don’t wanna~~~ even if I get a bit less, I’m going with Company A which is relatively more certain”
On the other hand, a person who enjoys high-risk, high-return would probably leave just this one line and pick Company B
“Hey. Life’s a one-shot deal.”
So now this is
the indifference curve of utility that I mentioned a little bit above.
To really understand the indifference curve well,
you’d actually have to draw the 3D surface and talk about this and that~~~~~~
but in microeconomics, I derived indifference curves for preference over goods — not about return and risk, but still
I think reading through that once would help with understanding. (http://gdpresent.blog.me/220754305556)
Indifference curve, Utility Function [ Microeconomics I studied #…
Continuing right from the previous posting. No introduction. If you’re curious, read the previous posting and continue…
gdpresent.blog.me
Isoquant is in the same vein as indifference curve,
so I’ll link it too. It’d help, right??T_TT_TT_T ( http://gdpresent.blog.me/220757837807 )

Isoquant [ Microeconomics I studied #24 ]
In the previous posting, where did we get to — we’d gotten to drawing MP_L and AP_L all together. So from here, more …
gdpresent.blog.me
Anyway, so this is the indifference curve of utility.
It’s called the indifference curve (muchabyeol gokseon)
If I just mention briefly what it means
The curve has countless points. Among those countless points, I’ll just pick any two arbitrary points and explain.
There’s a stock called A, and this stock A has an expected return of μ_A and a standard deviation measured as risk of σ_A,
and there’s also a stock called B, and this stock B has an expected return of μ_B and a standard deviation measured as risk of σ_B.
But what the indifference curve means is that some person feels the same utility when choosing stock A and when choosing stock B.
No wait, there are actually countless points, right??? All~~~~ those countless points are the set of stocks that the individual ‘feels indifferent about’.
But the fact that A and B feel the same utility is actually a head-scratcher.
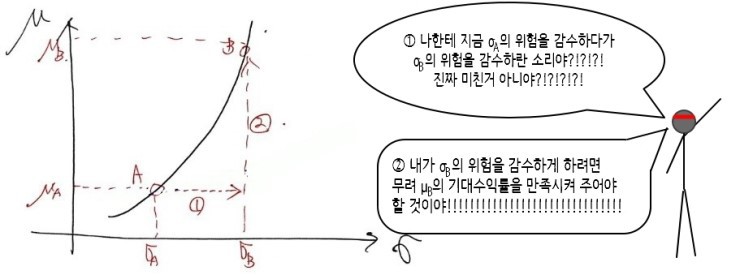
On the other hand, someone who’s somewhat stingy about risk
and puts more emphasis on expected return,
someone who enjoys high-risk, high-return — their indifference curve wouldn’t be that shape,
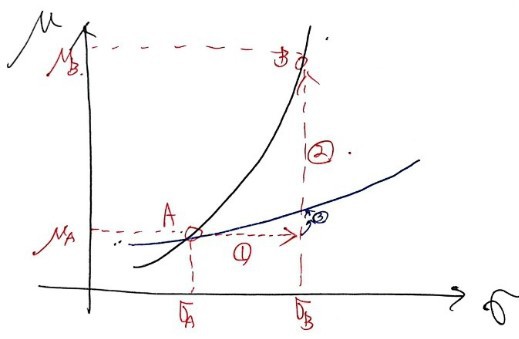
it’d be this shape….. ????
This guy would be different from the person above with the red headband who’s fiercely opposing. lolol
It’s a bit of an exaggeration,,,,
let me explain it like this
So from that weird picture above, we learned
“if the slope is steep, it’s the indifference curve of someone who hates risk more.”
And I’ll just mention one more thing briefly.
For the μ-σ indifference curve, the utility function that’s “above” represents a state of greater utility.
This is easy to check
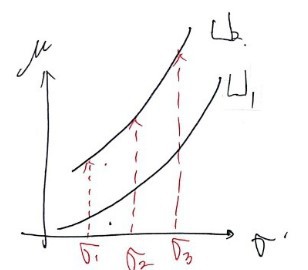
Whether someone’s conservative about risk or aggressive,
either way both are humans after all, so at the same risk, they’d prefer the one with the higher expected return,
so in the above picture, U_2 has greater utility than U_1!!!!!!!!!!!!!!!!!
Now this indifference curve is for our earlier dilemma

how should we choose in this kind of situation
I said it’s person by person,
so how does the person-by-person choice get made?!!??!
I mentioned the indifference curve to explain this,
so now let me answer the question above.
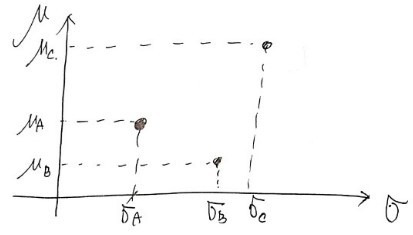
Let’s say there are 3 stocks A, B, C.
The expected returns and standard deviations of the returns of those stocks
are μ_A,B,C & σ_A,B,C, and let’s say each of their sizes is like in the picture above.
Then which stock should we pick?
Okay first let me take out what needs to be taken out.
First, stock B can be thrown out.
Its return is lower than A and its risk is bigger…
Someone who picks B instead of A is probably in a realm beyond human, so you can just report them to NASA
and A and C — we can’t clearly say which is more superior.
OkayOkayOkayOkayOkayOkayOkayOkay
So
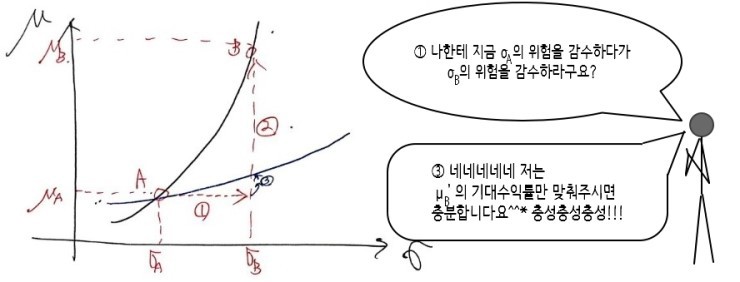
someone who absolutely hates risk
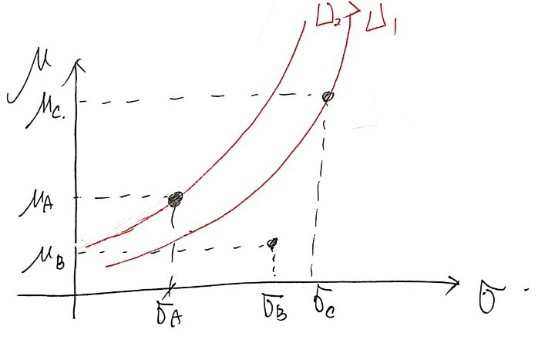
would draw it like this, so this guy would probably pick stock A,
and the guy from before who was going on about loyalty loyalty,
his indifference curve would be lying down a bit more than this guy’s, so
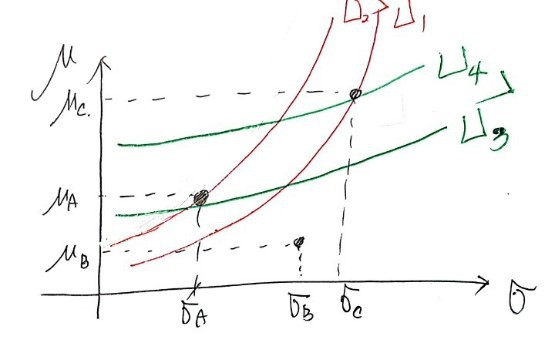
it’d be arranged like this,
so this guy, when picking stock B over A,
would get greater utility……
that’s what I meant hehehe
For chapter 9 problem-solving,
the exercises in chapter 9 are
at the level of high school math class statistics problems,
so I’ll just skip it…hehelol
Originally written in Korean on my Naver blog (2016-12). Translated to English for gdpark.blog.