Portfolio Variance and Covariance Matrix
We level up from single-stock picking to full portfolio selection — figuring out how to compute a portfolio's μ and σ using the covariance matrix.
In the previous chapter, we learned that if there’s some asset with a given μ and σ,
people choose the asset that maximizes their utility
according to their own individual utility functions.
So this time, following up on the previous chapter which was about ‘asset selection’, let’s bump it up one dimension to “portfolio selection”.
Let me briefly touch on what a ‘portfolio’ is before moving on,
first, the dictionary meaning of portfolio is “a collection of financial assets such as securities owned by an investment institution (or an investor)"~
Now, in our world, various assets are used as investment targets,
land, buildings, real estate, stocks, bonds, gold, paintings, etc. etc.
anything can be a target of investment.
That is, a portfolio is the group of assets that aggregates all of these.
But then, why do hoomans invest in such a wide variety of assets???
There’s a saying,
“Don’t put all your eggs in one basket.”
That is, the fundamental reason for investing in such a variety of assets is to reduce risk by means of ‘diversified investing’.
But here, let’s set aside the broad-sense portfolio
for a moment,
and think of a (narrow-sense) portfolio that contains ‘various stocks’.
This is in order to discuss the portfolio theory of finance.
Then


if these two kinds of portfolios are in front of us,
which portfolio should we choose~~~~
this is what we’re going to be discussing now.
Ack!!! But surprisingly, the answer comes out quite simply.
For each portfolio, compute μ and σ,
and choose the portfolio with the μ and σ that maximizes your own utility….
we can say it simply like that.
Ah, so!
we have to know the μ and σ of the portfolio first,
before we can even figure out which one maximizes our utility.
This is how portfolio theory begins.
So first, very simply,

let’s assume this kind of simple portfolio
and gradually move in the direction of raising the dimension.
Argh!
Previously, for an individual stock,

we learned how to set up a probability distribution through scenario analysis,
and based on that, compute the μ and σ of the individual stock. But
for something bundled like this

(a portfolio),
how do we measure the expected return of the portfolio and the risk of the portfolio..
First, for an individual stock


and

since we covered how to derive these earlier,

,

,

,

let’s say all~~~~ of these have already been computed.
First, the expected return of the portfolio is

computed like this.
w_i is the investment weight invested in stock_i out of the total invested assets making up the portfolio.
For example, suppose you invested 10 million won evenly across stock_1 and stock_2,
if 4 million was invested in stock_1 and the remaining 6 million was invested in stock_2,
that means w_1 = 0.4 (40%), w_2 = 0.6 (60%). (So of course w_1 + w_2 = 1 would naturally hold.)
The formula representing the expected return of such a portfolio seems to kind of make sense.
Because it’s saying that each expected return is weighted-summed by its investment ratio.
So generalization seems easy too. If it’s a portfolio containing n stocks instead of 2,

it becomes like this,,,, easy~
But the standard deviation of a portfolio gives us something to think about.
First, let me throw out the formula.
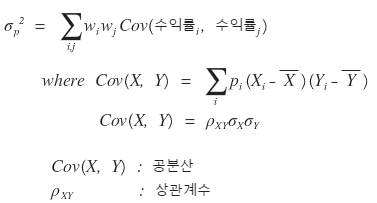
For a portfolio of 2 stocks, the variance of the portfolio is

they say it’s calculated like this,
(each one is the return standard deviation of stock_1, the return standard deviation of stock_2, and the covariance.)
Ah… actually, the formula that represents the more fundamental definition is
Pretty overwhelming, right……yeah….same for me….
I’ll explain every single one~
Why!!!! does the standard deviation of a portfolio have to look so insanely messy….?????????????
It’s simple.
First, it’s easy to understand if you know the operational laws of Variance.
When we know Var(X) and Var(Y),
let’s work out Var(X+Y).
Since Variance means the average of the squared deviations,
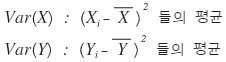
it would be like this??????????
Then thinking along the same lines for Var(X+Y),

it would be like this????
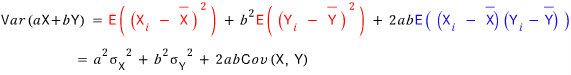
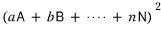
But more generally, let’s say the coefficients of X and Y aren’t 1 but each has coefficients a, b.
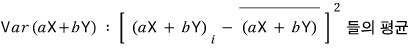
Notation: Example.
E(X): mean of X,
E(X+Y): mean of X+Y,
we used this notation back in high school, you remember right? I’ll go with this notation.
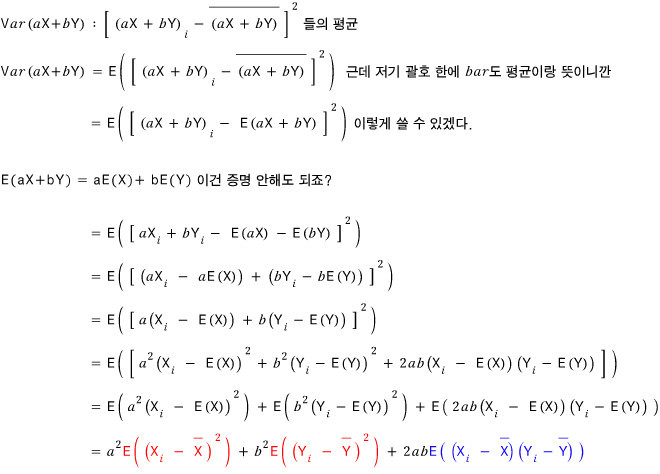
The red part is the average of squared deviations, and you can see each is the variance of X and the variance of Y,
and the blue part was referred to above as “the definition of covariance”.
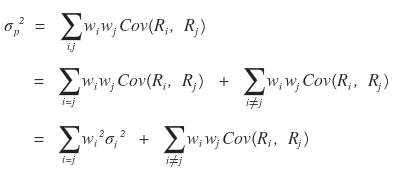
That is, the above equation can be concluded as follows.
So now we
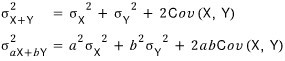
can confidently say this~
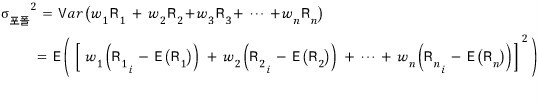
That is, the ‘variance of a portfolio’
is the ‘variance of the portfolio’s expected return’, so
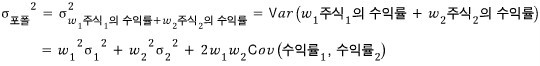
that’s why it was defined this way!!!!
Quick notation note — I was worried about confusion with μ (the mean of returns / expected return), so I’d been spelling out ‘return’ explicitly. From here on, I’ll just use R.
μ is clearly different from R — it’s the ‘mean of returns (expected return)’ — so you mustn’t get them confused~
R is the return in each scenario,
and when I write R_1, it means the return from stock_1 in each scenario!!
Okay so let’s say the portfolio has 3 stocks. stock_1, 2, 3.
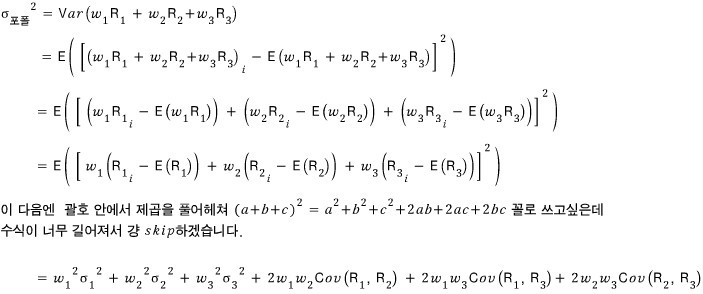
Whoa, messy~
Now we kind of get a feel for what the form is like for n stocks too.
Aaaah~~~~~
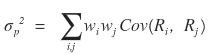
This is why the variance of a portfolio
was related to a form like this~
So now,

you can see why this definition was thrown at us, right hehehe
Maybe not yet.
I skipped over some things a little…
I’ll tie up all those gaps and finish.

This notation is a bit bothering me. It’s easy. Actually, this notation
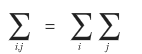
is the same thing as this.
I’ll take n=4 or so and

expand this out carefully once, so you should get the feel from it.
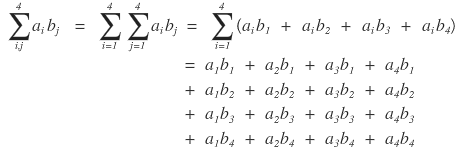
Once you see the pattern,
so whenever something like

this kind of expression comes up, I think of it as “not worrying about duplicates, just shoving everything in.”
→ (Actually this idea can be summarized in one word, ‘array’, and an array is what’s called an array, i.e., in the 2D case, it can be associated with a matrix.)
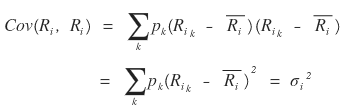
And just in case, let me briefly mention covariance before moving on.
The covariance here is an index that tells you what kind of correlation~~~~ the returns of two stocks have, under what kind of correlation they move~~.
I’ll copy and paste this content.
————————-copy-paste warning—————————-
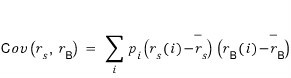
It’s this, and if I break this formula down a little to explain,
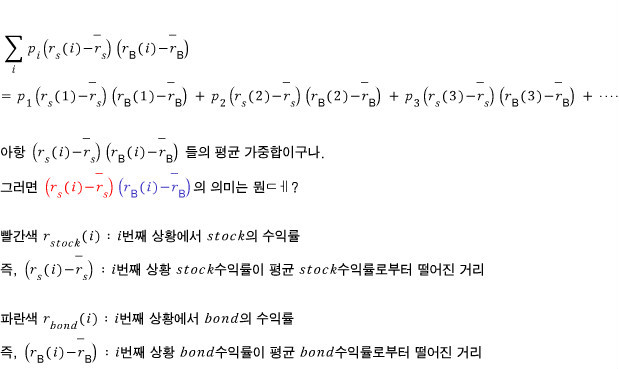

ah so the meaning of this formula feels a bit tangible now.
It’s a weighted sum, yes, a weighted sum,
but it’s a weighted sum where the tendency of how far off from the mean they are gets multiplied in.
That is, knowing the Cov value
can be seen like this.
“Oh, the Cov value is (+) positive?! Then generally the returns of stock and bond are going in the same direction.”
“Oh, the Cov value is (-) negative??!! Then generally the returns of stock and bond flow in opposite directions!!”
And the Key point is, interpreting by the magnitude of the Cov value is….
a bit ambiguous.
What’s ambiguous is,
the Cov value being (-) how much negative doesn’t tell you how strong the opposing movement of the two returns actually is.
There needs to be a standard for whether that Cov value is big or small, right.
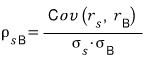
So we Normalize this.
We normalize it by their standard deviations,
and that number is called the correlation coefficient,
and you write it like this.
If you calculate it this way,
the maximum magnitude of that value becomes 1, so
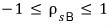
it falls into this inequality, you see.
It’s only when written this way that we can
“Oho, so it’s negatively correlated~ (or positively correlated) by a lot~~~ (or a little~~~)”
interpret it like this.
————————-end of copy-paste————————
And one more thing!

when this formula was for n=2,

we said it becomes this….
then

I think it’d be better to show a form like this once.
Sticking to the definition, let me compute it exactly~~~~ as is.
So

this formula
is also written organized like this~~~~
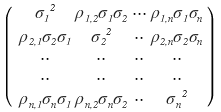
Finally, let me mention the ‘covariance matrix’, which I haven’t touched on above, and wrap up.
The formula right above…. the one before we organized it,
let me expand this formula out like a dummy, brute-force style.
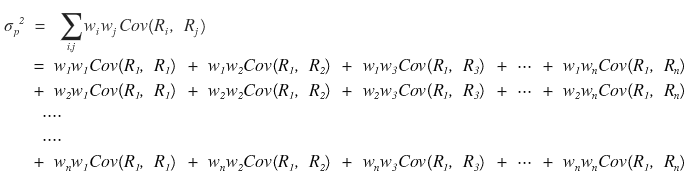
This is how it would expand,
and I’ll take this brute-force expanded formula and
Equal~~~~
drop down an (=) right there,
in matrix form,

and say it equals that massively-listed sum up above…..
isn’t this 100% legit, no-cap, can’t-deny??????????
If you expand the matrix out, it becomes the sum form of that massive list of numbers up there………..
uuuuuuuuu
We call this

matrix the ‘covariance matrix’~
And well, using the forms of the covariance and correlation coefficient definitions, we can of course also express the above covariance matrix
in the form of ‘variances and correlation coefficients’!!!!!!!
So, since the relationship between covariance and correlation coefficient is a normalization relationship,

we said they’re in this kind of relationship, right?
So
that covariance matrix can equivalently be
written like this.
Ah but honestly,
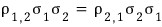
aren’t these obviously the same value?????
Measuring the correlation between 1 and 2 and measuring the correlation between 2 and 1,
of course they’d be the same lolololol
That is,

since this holds, the above covariance matrix has no choice but to be a “symmetric matrix”.
(Also, because variance values can only be positive, there’s also the fact that it has to be positive definite.)
But, those σ_1 ~ σ_n up there could all~~~ be 1.
When could that be, you ask?
If we assume returns follow the standard normal distribution, then all~~ those σ_1 ~ σ_n can be 1.
This content is used at http://gdpresent.blog.me/220889100669
My study of financial engineering programming #22. Cholesky Decomposition, corr…
This time we’ll cover Cholesky Decomposition, and to do that, a math talk…
blog.naver.com
.
So in that post, the covariance matrix
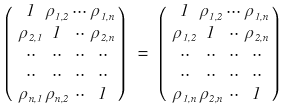
was written like this, and that’s how it became a “Correlation Matrix”~
There’s so much to talk about, but I’ll cut it here and go.
I’ll continue right~~~ into the next post.
Originally written in Korean on my Naver blog (2016-12). Translated to English for gdpark.blog.