Hedging Strategies Using Futures
A quiz-style walkthrough of futures hedging — short vs long hedges, basis risk, optimal hedge ratios, and beta reduction with index futures.
quiz 1. When do you use a short hedge vs a long hedge?
A short hedge works when a company already holds an asset and plans to sell it later.
(Also works when the company doesn’t hold the asset yet but expects to.)
A long hedge works when a company plans to buy an asset later.
(Also works to offset risk from an existing short position.)
quiz 2. What’s the basis risk that shows up when you hedge with futures?
Basis risk comes from the uncertainty about the gap between the spot price and the futures price at the moment the hedge expires.
quiz 3. With futures hedging, does a perfect hedge always beat an imperfect one? Why?
A perfect hedge wipes out the hedger’s risk completely… but that’s not always better. It just gives you a more certain outcome.
quiz 4. When does the minimum-variance hedge portfolio fail to hedge anything at all?
When the correlation coefficient between the change in futures price and the change in price of the asset you’re hedging is 0 — then the minimum-variance hedge does literally nothing.
quiz 5. Can a CFO decide not to hedge a particular risk? Give 3 reasons.
a. If competitors aren’t hedging, the CFO feels less pressure to hedge either.
b. Shareholders may not actually want the company to hedge.
c. If the hedge takes a loss while the underlying asset moves favorably, it’s hard for the CFO to explain to the rest of the C-suite why hedging was justified in the first place.
quiz 6. The standard deviation of quarterly commodity price changes is $0.65, and the standard deviation of quarterly futures price changes for that commodity is $0.81. The correlation between spot change and futures change is 0.8.
What’s the optimal hedge ratio using a 3-month futures contract? What does it mean?
Optimal hedge ratio = $0.8 \times 0.65 / 0.81 = 0.642$. Meaning: for a 3-month hedge, your futures position should be 64.2% of the size of your exposure.
quiz 7. A company owns a stock portfolio worth $20 million with $\beta = 1.2$. They want to hedge with S&P 500 index futures. The index futures price is 1080, and one contract is index futures price $\times$ $250.
What’s the risk-minimizing hedge ratio? And how do they bring portfolio beta down to 0.6?
Number of contracts to short:
$$1.2 \times \frac{20{,}000{,}000}{1080 \times 250} = 88.9$$Round up — sell 89 contracts. To get $\beta$ down to 0.6, you only need half the short, so 44 contracts.
OK so what this chapter is really asking, supposedly, is: “How close can we get to a perfect hedge?!!!”
When should we sell or buy futures to get a perfect hedge, which futures should we use, how many are appropriate, etc etc.
But for now, to keep things nice and easy, we’ll roll with the hedge-and-forget assumption — once you put on the hedge, you don’t touch it.
Literally — the moment you turn around, you forget about it.
(In reality you’d keep one eye on it and tweak it constantly. That part comes waaay at the end of the book, apparently.)
Oh, and like I mentioned before, one feature that distinguishes futures from forwards is daily settlement (mark-to-market) — and here, even though we’re talking about futures, we’re going to ignore that. Apparently.
What this assumption buys us is: the profit on the futures contract doesn’t trickle in day by day over the hedge period — it all shows up at once on the closing date.
If money were flowing in daily through mark-to-market, you’d have to think about interest on that incoming cash, compounding, taxes, an absurd number of things — but we’re ignoring all of that and aiming our eyeballs squarely at hedging.
With that out of the way, let’s start with the basic principle of the short hedge.
Truly basic.
A short hedge is:
- a hedge that hedges by going short in futures,
- used when the hedger already owns an asset (or wants to sell that asset at some future time),
- and apparently it also works when the hedger doesn’t currently own the asset but plans to.
OK so how does this even hedge anything?
Hmm…. think about an exporter who’s going to receive euros in the future. If the euro rises, profit. If it falls, loss.
Against that risk, take a short position in euro futures.
Now the picture flips: euro rises → loss on the futures, euro falls → profit on the futures.
That’s how a short futures hedge works.
Honestly let’s just look at an example.
Ex. 3.1
On May 15, an oil producer locks in a contract to sell 1 million barrels of crude oil 3 months out.
- Spot price of crude: $80/barrel
- August-maturity crude futures price: $79/barrel
Since this kind of futures product exists, the hedge looks like:
- May 15: Sell 1000 contracts of August-maturity crude futures
- August 15: Close out the short position
The producer locks in the price at $79.
If on August 15 crude has fallen to $75/barrel, this producer still gets to sell at $79 — gaining $4/barrel. If crude jumps to $85, they have to transact at $79, eating a $6/barrel loss.
Either way, this person can plant their flag at “$79/barrel” and put their risk around that number.
Cool, right…? It kind of feels totally obvious, but the vibe is that we take this obvious-looking thing, call it ‘hedging,’ and dress it up all fancy???? So I’m just gonna skip the long hedge.
But — we did that super simply above, so it feels too easy.
In reality, hedging isn’t actually that easy.
First: the asset being hedged and the underlying asset of the futures contract are often not the same thing. That’s point one.
Second: the act of hedging itself can move the market, which makes it not easy.
Third: the hedger usually has to close out the futures contract before maturity — and like I said earlier, as you approach maturity, the spot price converges to the futures price.
But how close is “close” before that maturity date? You don’t know, right???????????
That is,
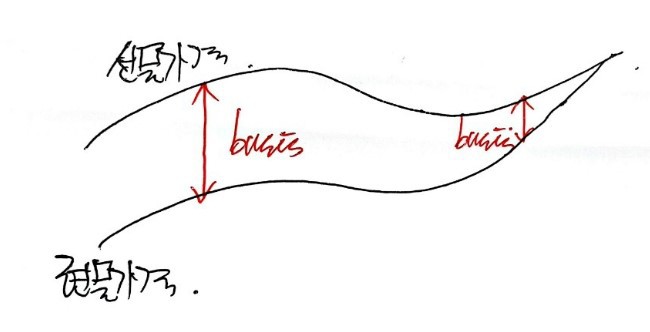
you get the following risk from the price gap.
(Or it could be the gap between the spot price of the asset you’re hedging and the futures price of the underlying asset you’re hedging with.)
So because of this basis risk — the futures price and the spot price might or might not differ — hedging is not so easy.
But how to deal with basis risk? Not covered here. (sob)
Just a “hey, this thing exists~” kind of moment.
For terminology though:
- strengthening of basis: the basis is increasing
- weakening of basis: the basis is decreasing
Just file those away and move on. heh heh heh
Now, let’s quickly touch on linear regression, which gets used (frequently?) in econ.
Throwing out a formula and using it without thinking is…. something I really don’t like,
but as we go further the formulas start running wild, and I don’t think I’ll have the bandwidth to derive everything in time….
So I’ll derive this one. Just this one.
Because it’s truly important! It’s used in econ and in basically every other field too!
OK so what does linear regression actually want to do?
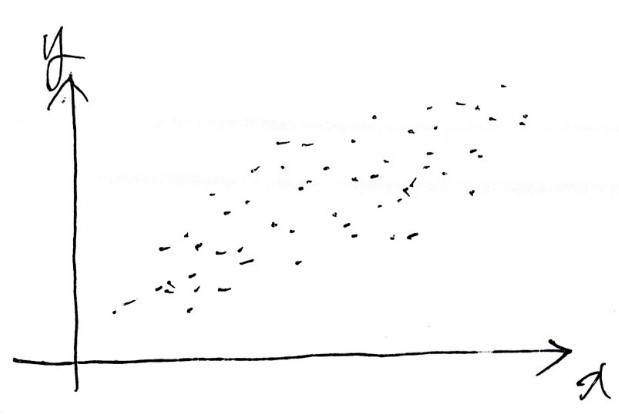
Say we’ve pulled out a bunch of data like this.
The graph we want — the one that best represents these points, or that we’d use to extrapolate to bigger or smaller $x$ —
which one is it??????
Constraint: it has to be a straight line.
Pulling it out as a curve is for next time^^
Pulling it out as a straight line has a very important property.
The important property — you’d know it if you’ve studied linear algebra,,…. no need to get into it here.
(Apparently that’s also why, in academia, people make such a big distinction between linear and nonlinear.)
The other thing is that nonlinear is insanely, ridiculously, impossibly hard. So we’re going linear!!
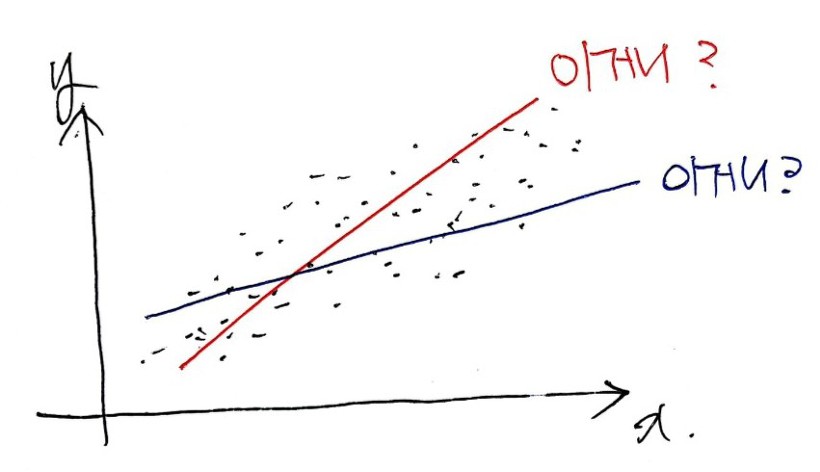
So — which straight line best represents the data?
Ahhhhhh, what should we even use as the criterion for “this line represents the data well”?!?!?!?
The Error.
That is, the line that minimizes the error

is the one we want.
Luckily, a straight line’s whole identity is just slope and y-intercept — so we just need to find the slope (square) and y-intercept (triangle) that minimize the error.
OK, so how do we handle that error?
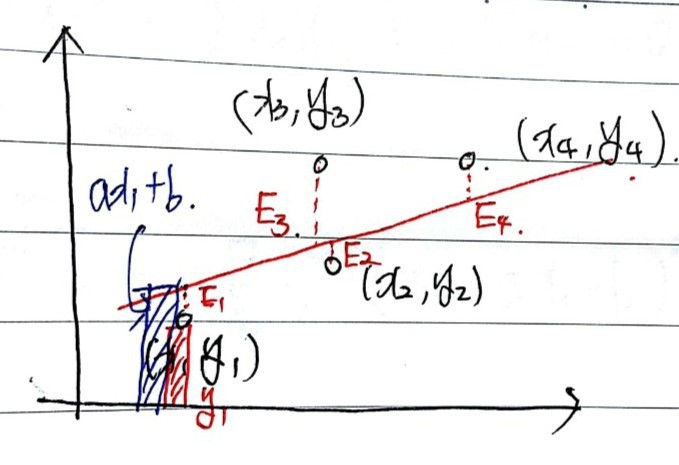
Say there are some black data points.
We want to find $y = ax + b$ that best represents them — so we’re solving for $a$ and $b$.
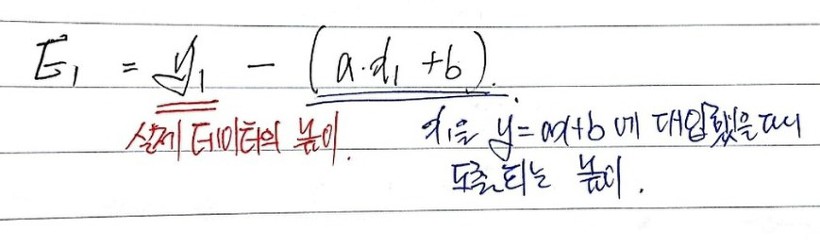
Suppose the best-fit line is the red one. Then the errors for that line are $E_1$ through $E_4$ as drawn.
For these errors to be smallest — does that mean we want $a, b$ that make $E_1 + E_2 + E_3 + E_4$ as small as possible?!?!?!?
BZZT. Wrong.

We want $a, b$ that make the sum of squares as small as possible.
(Reason: the $a, b$ that minimize the linear sum of $E_i$ aren’t unique — kind of awkward to phrase that way — and it’s the same principle as in high school stats. When you want variance, the spread of your data, you don’t average the deviations from the mean, you average the squared deviations. Same exact principle.)
So now we can quantify the error, right???
Yes indeed~~~~~~

Let me write out the sum.
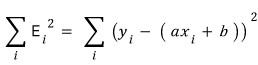
Call this sum of squares big $E$.
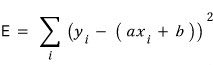
Now, how do we find $a, b$ that minimize $E$?
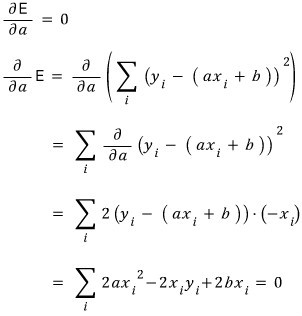
Think of $E$ as a function of two variables, $a$ and $b$. The extreme value of $E$ should be the minimum, so when we partial-differentiate $E$ with respect to $a$, and partial-differentiate with respect to $b$,
we want both partials to equal zero.
Let me write out $\partial E/\partial b = 0$ too.
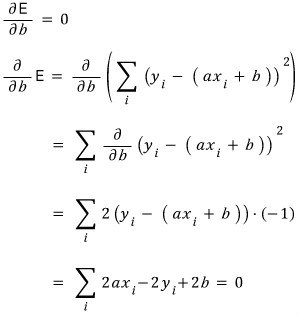
So the two equations $a, b$ have to satisfy are
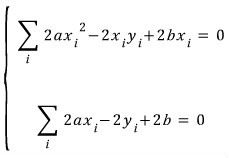
precisely those two, and
cleaning them up a bit:
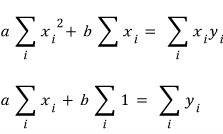
Oh ho — let’s solve the system to find the $a, b$ that satisfy both at once.
(Naver’s equation editor, please wake up and become more convenient for the people writing posts! Get better!!)
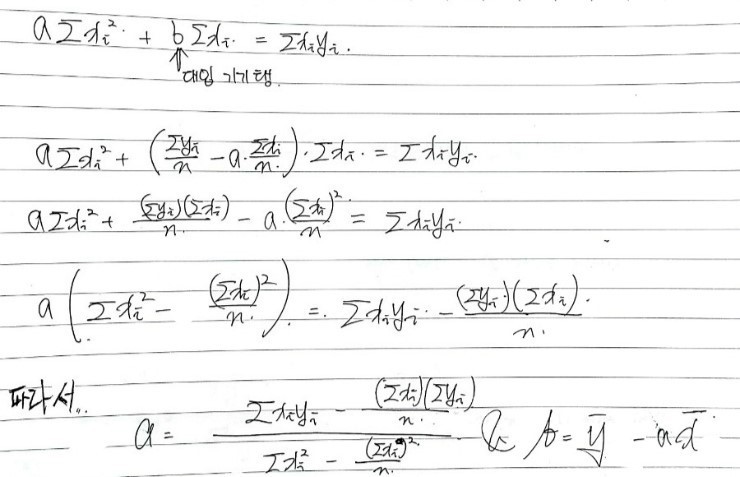
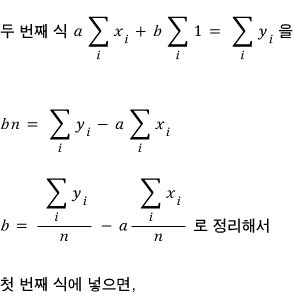
And just like that, the game of finding $a, b$ ends pretty anticlimactically — but to write $a$ in a slightly different form,
let me mess around a bit more.
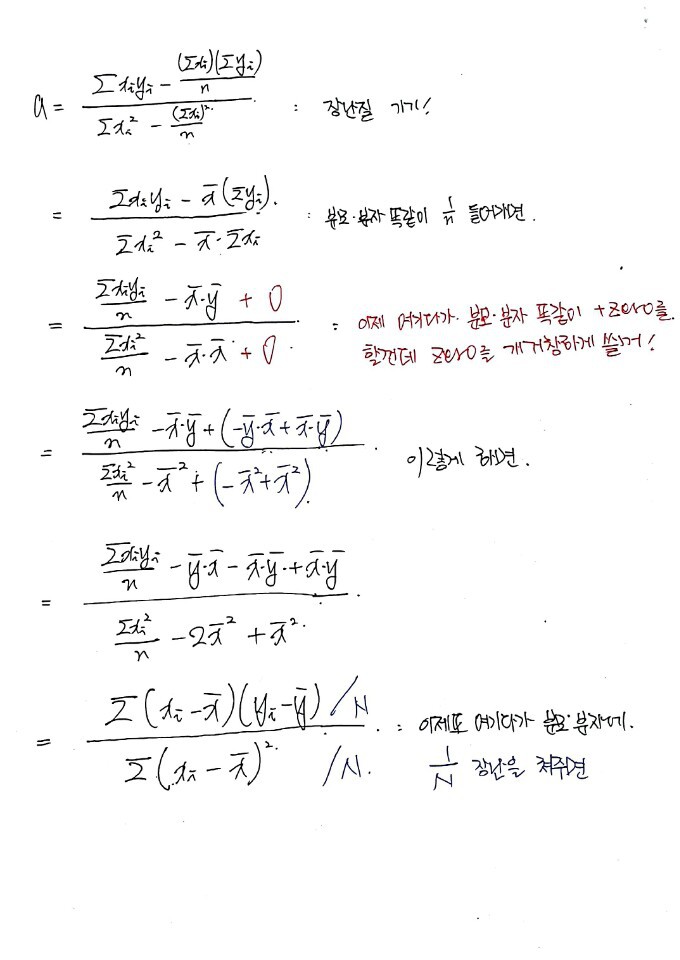
Looking at the data,
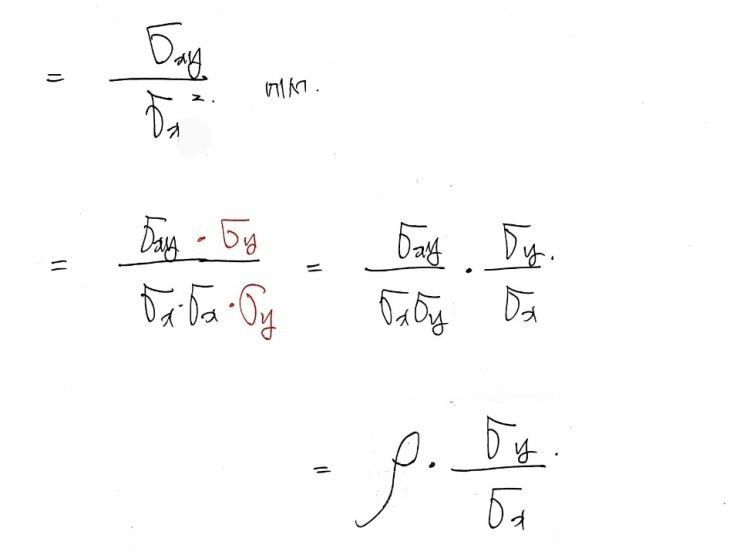
we’ve shown that the slope $a$ of the best-fit line is

Oh — there’s something I skipped. Here, $\rho$ is the correlation coefficient.
Anything else I forgot??????

is what’s called covariance!!! That too!!!
Covariance has a statistical definition, and from that you get the correlation coefficient!!!
What does the correlation coefficient mean????????
I talked about it elsewhere:
http://gdpresent.blog.me/220683687705
My Studies in Basic Investment Theory #10. Diversification
Earlier, I posited a risk-free portfolio F and a risky portfolio P, and then within risky portfolio P…
blog.naver.com
But —
here $x$ is $\Delta F$: the change in futures price over the hedge period
here $y$ is $\Delta S$: the change in spot price over the hedge period
So if we call the minimum-variance hedge ratio $h^*$, it’s defined as

Think about it for a sec —
it actually feels really natural that $h^*$ is defined as

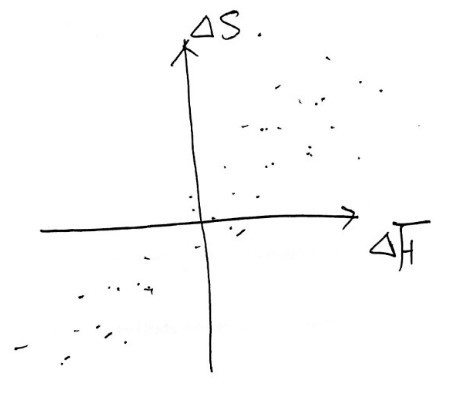
For some given period, plot the historical $\Delta F$ and $\Delta S$ as points,
fit the best-fit line,
then use the slope of that line as the hedge ratio!!!
So when futures price moves by this much, spot moves by roughly that much — and the relationship is reined in once more by the correlation coefficient — and we capture that amount!!!
So again, again — if the spot price change is 4, the futures change (after accounting for correlation) is 2, and since spot moved by 4 we defend with 4-units-worth using futures!!!
That’s the kind of intuition… (I’m just freestyling here and now I’m a little worried I’m causing unnecessary conceptual confusion.)
So since we need to defend by the same quantity,
we now scale by $h^*$ and figure out the number of contracts.
That is, the optimal number of futures contracts is

- $N^*$: number of futures contracts for the optimal hedge
- $Q_F$: quantity per futures contract
- $Q_A$: quantity of the position being hedged
OK, let me actually use these variables — by transcribing Example 3.5.
Ex. 3.5 An airline plans to buy 2 million gallons of jet fuel one month from now and intends to use heating oil futures to hedge.
Looking at $\Delta S$ (jet fuel price change per gallon) over 15 consecutive months and $\Delta F$ (corresponding change in heating oil futures price), we get $\sigma_F = 0.0313$, $\sigma_S = 0.0263$, $\rho = 0.928$.
$h^* = 0.928 \times 0.263 / 0.313 = 0.777777777777777777777777777777$.
One CME Group heating oil futures contract is 42,000 gallons, so the optimal number of contracts is
$$N^* = 0.7777777777777 \times \frac{2{,}000{,}000}{42{,}000} = 37.03$$So 37 contracts is the optimal hedge.
But — in practice, the hedge ratio isn’t determined as

it’s actually determined as

apparently. This is a formula that corrects for the effect of daily settlement, and
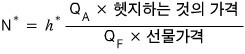
$V_A$ and $V_F$ here mean value.
For forwards though — no daily settlement, no correction needed — so


we can use these formulas, right?!?!
Now let’s also think about hedging a portfolio.
Specifically — a stock portfolio.
Stocks settle daily, so

this formula is what we use.
Wait — hold on. $h^*$ was the slope w.r.t. changes in $F$ and $S$, right????
So writing $h^*$ here actually feels wrong.
Here, think:
- $F$: what we’ll hedge with
- $A$: what we want to hedge (my portfolio)
Then what’s playing the role of $h^*$ — the relationship between my portfolio and the stock index?!?!?!?
I haven’t posted on CAPM yet, have I????????
Within the next few days I’ll put up a derivation of the CAPM model.
If you know CAPM, you’ll see that what plays the role of $h^*$ here is the stock’s beta ($\beta$).
So the hedging ratio for a portfolio with $\beta$ is

and each $V$ here is:
- $V_A$: current value of the stock portfolio
- $V_F$: current value of one futures contract (futures price $\times$ contract multiplier)
Done.
Now if we idealize and assume the hedge is perfect, the portfolio’s return becomes constant.
Heh heh~
In CAPM, the portfolio return is

right? For that return to become constant means
precisely $\beta = 0$.
Yep. The synonym for “hedge perfectly” is “make $\beta$ zero.”
But here’s the thing to think about — is making beta zero always good, no matter when, no matter where? By using this ratio cleverly and tuning it, instead of forcibly dragging a $\beta = 1.5$ portfolio down to zero, you can make it $\beta = 1$, or $\beta = 0.5$,
or crank it up to $\beta = 2$ to be more sensitive to the market.
Think of it this way. To take a $\beta = 1.5$ portfolio down to $\beta = 0$, the number of (let’s say) short futures contracts is

Hmm. $\beta = 1.5$ means
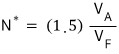
that’s the number of contracts, yeah?
Now — instead of clearing out the full 1.5, what if you only want to drop $\beta$ by 0.5, down to 1.0?
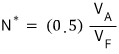
use this many contracts. And if you want to drop by 0.75:
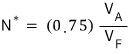
you can use this many.
So, going from $\beta$,

““““to””””

if you want to drop it by!!!!!!!! ’that much’!!!!!!!!!
’that much’ goes in the back, right???? That is,
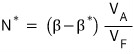
use this many contracts.
Conversely,

what if you want to raise beta by that much???!?!??
The negative of that….
That is,
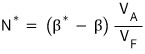
this time, instead of a short, you take a long position of that size — that’s all you need, apparently.
Prob 3.8
Corn futures on the CBOT have delivery months: March, May, July, September, December.
For each hedge expiration date below, pick the contract to use.
a) June b) July c) January
Pick the contract whose delivery month is closest to the expiration but after it!
- Expiration June → use July delivery
- Expiration July → use September delivery
- Expiration January → use March delivery…..end…..?
Prob 3.13
“If the minimum-variance hedge ratio is 1.0, that hedge should be perfect.” True or false? Why?
$h^*$ is the ratio of how many units to hedge with for one unit of exposure — but I don’t see why hedging 1 unit with 1 unit has to be a perfect hedge.
What makes a hedge perfect or not is $\rho$.
If $\rho = 1$, you can have a perfect hedge!
But even when $\rho \ne 1$, you can still get $h = 1$. So the statement is false!
Prob 3.16
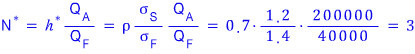
Standard deviation of monthly spot price change of live cattle: 1.2 (cents/pound). Standard deviation of monthly price change of the most-similar live cattle futures contract: 1.4. Correlation between spot and futures: 0.7.
On October 15, a beef producer plans to buy 200,000 pounds of live cattle on November 15.
The producer wants to hedge using December live cattle futures. One contract = 40,000 pounds. What’s the hedging strategy?
What’s making this beef producer anxious is that they’re going to buy, and they’re worried the price will be high when they do….
So they can use a long hedge, and the number of contracts is
Prob 3.18
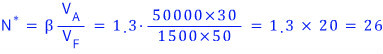
On July 1, an investor owns 50,000 shares of a stock at $30. They want to use September Mini S&P 500 index futures to hedge market fluctuations over the next 2 months.
The index futures price is 1500, one contract = index futures price $\times$ $50.
Stock’s beta is 1.3. What’s the strategy? Under what circumstances is it profitable?
What this investor is anxious about right now is — they’re scared the price will fall. So they can take a short hedge by selling in advance, and the number of contracts is
If the stock price falls more than expected — that’s when you profit, right???!?!?!?
(Because when it falls below the price you locked in by hedging-and-selling-ahead, you get to scream “phew, almost dodged a bullet!!!!”)
Prob 3.21
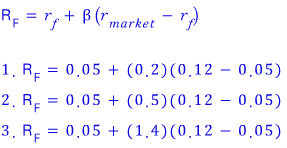
Expected return on S&P 500 is 12%, risk-free rate is 5%.
What’s the expected return on the investment when $\beta$ is 0.2, 0.5, 1.4?
This is just asking about CAPM, isn’t it….
Originally written in Korean on my Naver blog (2016-10). Translated to English for gdpark.blog.