Options Trading Strategies (Part 2): Combinations and Practice Problems
Wrapping up options combinations — straddles, strangles, strips, and straps — and figuring out which one to pick depending on your vol view and your wallet.
Alright, this time I’m wrapping up combinations — strategies built from two or more different types of options.
Three flavors on the menu:
- Straddle
- Strip & Strap
- Strangle
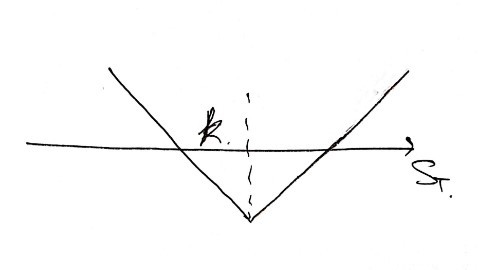
1. Straddle
Same strike, same expiration. Call and Put.
You buy both!!
OK so let’s just throw both payoff diagrams onto the same axes and see what happens at expiration.
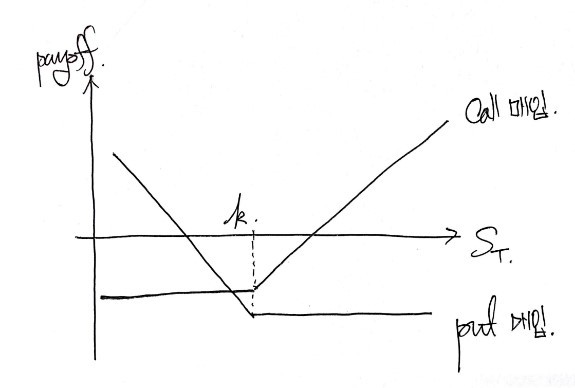
Yeah, something like that.
Quick note — I drew it with $p$ a bit pricier than $c$ here, but really:
- when $k$ is large → $c \downarrow$, $p \uparrow$
- when $k$ is small → $c \uparrow$, $p \downarrow$
So depending on where $k$ sits, you could have $c < p$ or $c > p$… it flips around. Bottom line: which one is more expensive doesn’t really matter.
Anyway — what’s the sum of those two payoff functions?
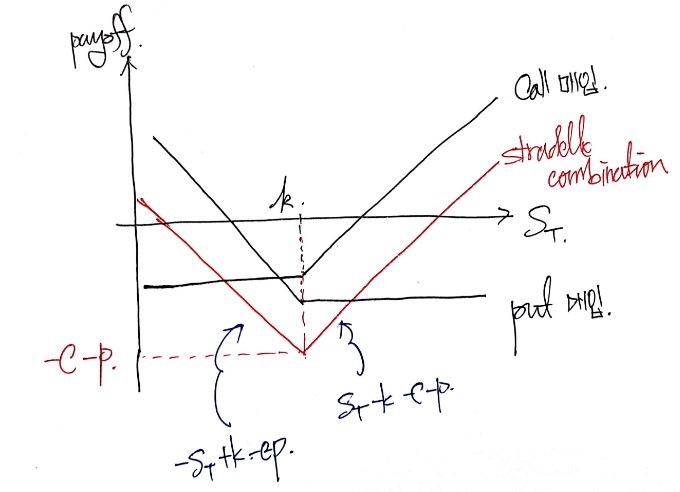
Now here’s the thing. If $S_T$ at expiration lands somewhere near $k$, the person sitting in the bottom straddle position (yes, that’s the actual name — long $c$ + long $p$) eats a fat loss.
So:
- Investor expecting high volatility → takes the bottom (long) straddle.
- Investor expecting low volatility → takes the opposite, the top straddle (short straddle).
Looks like that! hehehe
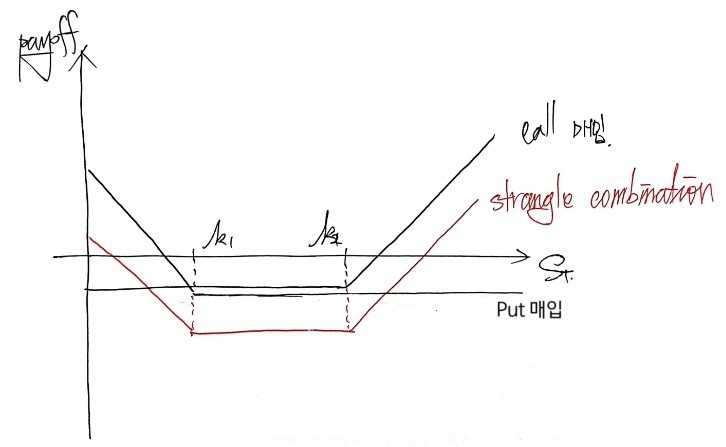
3. Strangle
Same idea — buy a call and a put — but this time with different strikes.
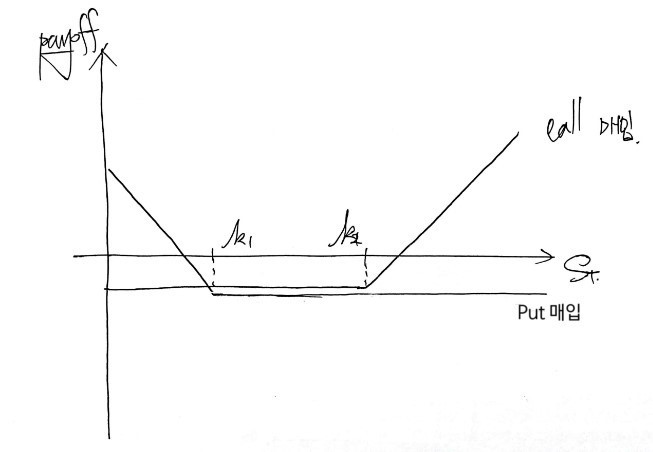
Combine like that and you get a strangle.
aaaaaaaa I need to draw the sum.
Drawing this stuff is a piece of cake by now~~~~
The setup: in a strangle, you set the call’s strike higher than the put’s strike (the direction where both options get cheaper). That pushes the profit zones a little farther out.
But hold on — think about it for a sec.
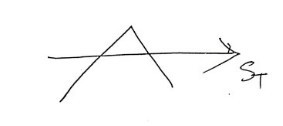
If you’re an investor expecting high volatility…
instead of a profit curve like that,
wouldn’t you rather have this one — and if vol really does blow up like you’re betting, ride the one that makes more money?!?!?!?!
In other words, the strangle is for the broke believer. You think vol’s coming, but you don’t have the cash.
- Expect high vol + got money → Straddle.
- Expect high vol + broke → Strangle.
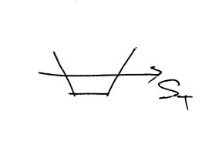
Side note: the names feel completely backwards to me. The pointy one is called “Straddle,” the saddle-shaped one is called “Strangle”… why??
I genuinely have no idea. (T_T)
2. Strip & Strap
OK back to straddle.
We said someone expecting high vol takes that position above, right?
But!!!
Suppose you expect high vol and you’ve got a directional view — say you think the stock’s going up.
If you’re truly, enormously confident in that direction, a Strap like the one below seems better than a vanilla straddle.
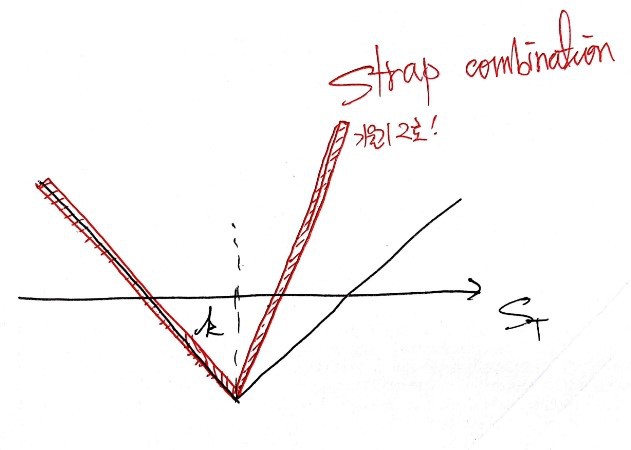
How do you build it? Just buy 2 Calls instead of 1 when you’re stacking the call side!!
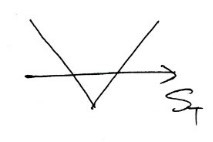
Flip it around — if you’re confident vol is high but the stock’s going down — you buy 2 Puts instead of 1.
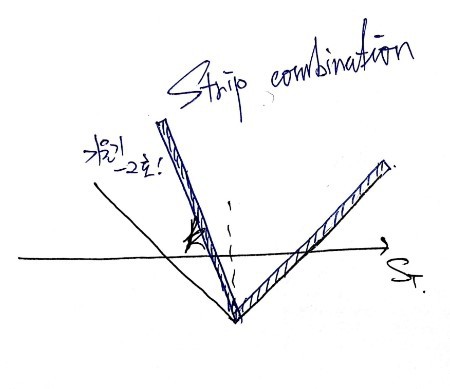
Make the left side of the graph have slope $-2$, like that. This one’s called a Strip.
And with that, Chapter 11 is officially done. heh
Quiz 1.
What is a protective put? Which call-option position is it equivalent to?
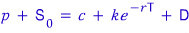
A protective put = long stock + long put.
By put-call parity, that’s equivalent to a chunk of cash + a long call:
Quiz 2.
Two ways to build a bear spread.
Way 1 — with calls (same expiration, different strikes): sell the call with the lower strike, buy the call with the higher strike.
Way 2 — with puts (same expiration, different strikes): sell the put with the lower strike, buy the put with the higher strike.
Quiz 3.
When does a butterfly spread make sense?
A butterfly uses 3 strikes ($k_1, k_2, k_3$). You buy the butterfly when you think the underlying will close near the middle strike $k_2$.
Quiz 4.
3-month calls with strikes 15, 17.5, and 20 cost $4, $2, and $0.5 respectively. Build a butterfly with these. Make a profit table over $S$.
Buy 1 call at strike 15, buy 1 call at strike 20, sell 2 calls at strike 17.5.
Initial cost: $(4 + 0.5) - (2 \times 2) = 0.5$.
The profit table at expiration (warning — brutally tedious):
- $S < 15$: $-0.5$
- $15 < S < 17.5$: $(S - 15) - 0.5$
- $17.5 < S < 20$: $(20 - S) - 0.5$
- $S > 20$: $-0.5$
Quiz 5.
How do you build a reverse calendar spread?
Buy the shorter-expiration option, sell the longer-expiration option. Done.
Quiz 6.
Strangle vs. straddle — what’s the difference?
Both are call + put combos.
- Straddle: same strike, same expiration.
- Strangle: same expiration, different strikes.
Quiz 7.
A call with strike 50 costs 2; a put with strike 45 costs $3. Build a strangle with these and describe the profit pattern.
- $S < 45$: $(45 - S) - 5$
- $45 < S < 50$: $-5$
- $S > 50$: $(S - 50) - 5$
Prob 11.8
Using put-call parity, compare the initial cost of a bull spread built from puts vs. one built from calls.
Bull call spread: buy lower $k$, sell higher $k$ → $-c_1 + c_2$.
Bull put spread: same setup → $-p_1 + p_2$.
Those are the initial cash flows. So in absolute terms, what you spend is:
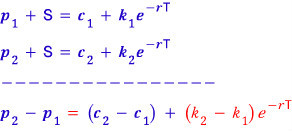
- Calls: $c_1 - c_2$
- Puts: $p_1 - p_2$
OK now, from put-call parity we can pull this guy out:
Now imagine the red term up there — which is positive — just vanishes. If a positive term goes missing from one side of an equation, the equality breaks.
One side gets bigger, one side gets smaller. Which way? The (+) term was on the right, and it disappeared, so the right side just shrunk a bit.
But we don’t actually want to compare 2 with 1 — we want the other direction. So multiply both sides by $-1$, which flips the inequality:
yes yes yes yes yes yes yes yes — the bull spread with puts costs a little less up front.
Why, intuitively? With calls:
the risk-free growth is baked in. With puts, that risk-free growth chunk is essentially excluded. That’s the gap.
Prob 11.10
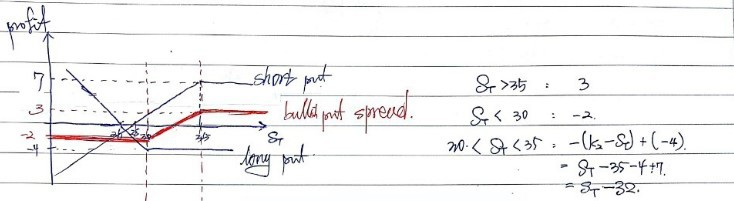
Puts with strikes 30 and 35 cost 4 and 7 respectively. Build a bull spread and a bear spread with them. Make payoff/profit tables.
This is all stuff we’ve already chewed through, so —
Bull spread: buy low $k$, sell high $k$. Just drawing the payoff straight up:
And the bear put spread:
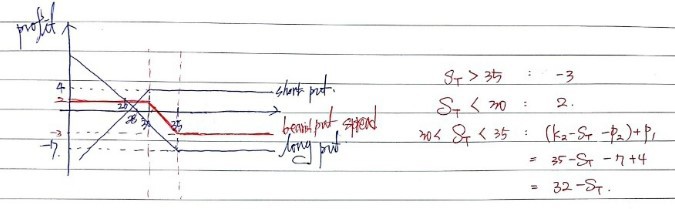
Honestly, this is enough, right? Once you sketch it yourself, finding the kink points is trivial. Try it once and you’re golden.
Prob 11.12
A call with strike 60 costs 6. A put with the same strike and expiration costs 4. Fill in the straddle profit table. For what range of $S$ does the straddle lose money?
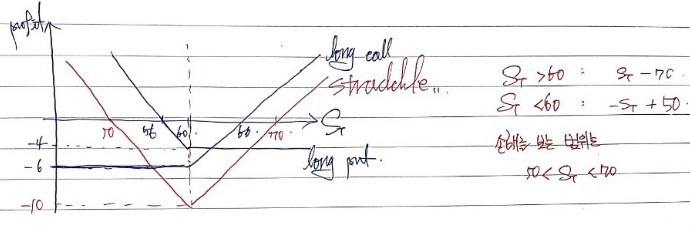
Ridiculously easy.
Prob 11.14
An investor doesn’t know which way the stock is moving but is convinced it’s going to move big. List six strategies they can use, and explain the differences.
From everything we’ve covered:
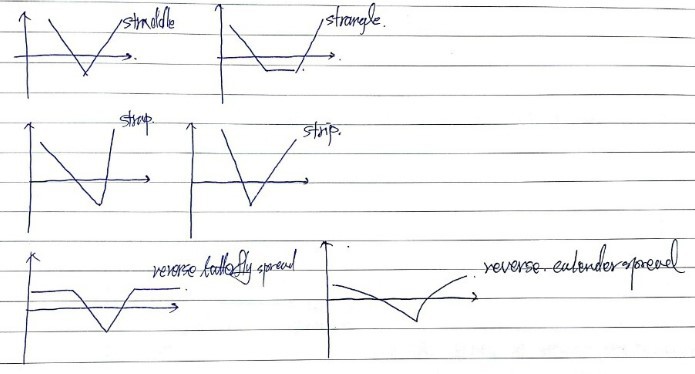
These six.
Prob 11.15
Using options, build a forward contract on a stock with a given delivery price and delivery date.
For ease of notation, call the call premium $c$.
The profit at expiration $T$ of a forward looks like this:
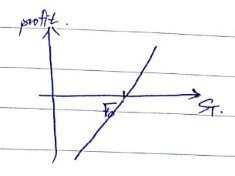
That same shape? You can build it with long call + short put.
Long call and short put on European options, same expiration $T$, same strike $k$:
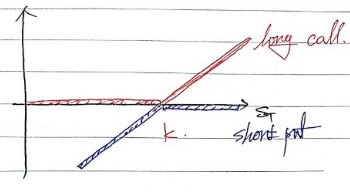
Add the two payoff functions and you get exactly the forward’s payoff curve at $T$.
So the forward you’ve synthesized with these two options has forward price $F = k$. heh heh heh heh.
Originally written in Korean on my Naver blog (2016-12). Translated to English for gdpark.blog.