Intrinsic Value & Time Value of Options
Option value splits into two pieces — intrinsic value (the profit you'd lock in right now) and time value (all that probabilistic could-happen-later stuff) — here's how they work.
Last time we talked about “the value of an option” — turns out that value actually splits into two pieces.

First up: intrinsic value!!!
This one’s easy. It’s the profit you’d lock in from the option if it expired right now — that is, the payoff you’d get at expiration, evaluated at today’s price. That’s it. That’s intrinsic value.
For a call, intrinsic value is the current price of the underlying minus the strike price. Right? That’s your gain — straight up.
But — what if the underlying is sitting below the strike?
Then there’s literally nothing to gain from exercising. Like, why would you?
Quick example. Underlying is at 10,000 won. Strike on the call is 12,000 won. Nobody in their right mind goes “yes please, I’d love to buy this at 12,000!” You just… don’t exercise.
Now flip it. Strike at 8,000 won, market at 10,000 won. “Market’s 10,000, but I have the right to buy it at 8,000?? Hand it over!!!” Yeah, you exercise. ok ok.
So the intrinsic value of a call option is $S - K$ or zero, whichever is larger.
Notice that intrinsic value isn’t one smooth formula all the way — it’s one or the other. A hard switch at the strike (a sharp kink, not a jump). Decisive.
($S$: underlying price, $K$: strike)
And by the same logic, the intrinsic value of a put is $K - S$ or zero (again, whichever is larger). Same deal!
Now let’s plot it. $S$ on the x-axis, profit on the y-axis. Starting with the call —
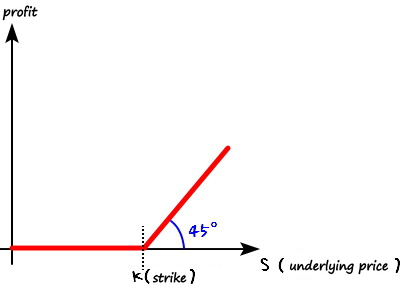
Two regimes, depending on whether $S$ is above or below $K$. For a call, if the underlying’s price right now is:
- below $K$ → out-of-the-money (OTM, the zone where you make nothing)
- above $K$ → in-the-money (ITM, the zone where you actually profit)
- right at $K$ → at-the-money (ATM, sitting on the boundary)
Those are the names.
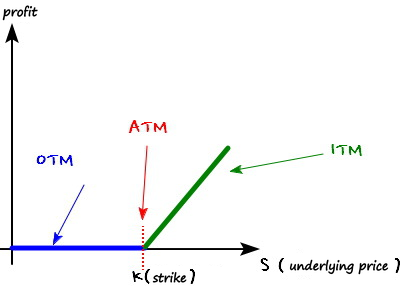
That picture’s the call. The put case is just the mirror image and you can totally figure it out yourself, so I won’t blabber.
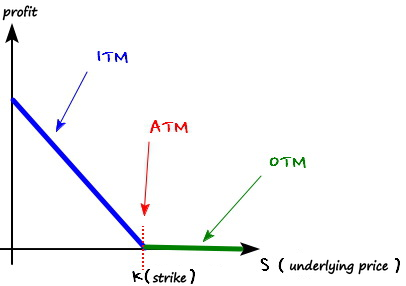
OK, intrinsic value — done. On to time value.
Obviously there’s more going on under the hood. Time left until expiration, volatility, interest rates, blah blah blah… All of that gets bundled into what we call time value (a.k.a. extrinsic value).
In one sentence: it’s the value of the extra profit you could lock in by exercising later, after the underlying has had time to drift around between now and expiration. And since we don’t know where it’ll drift to, this is a probabilistic expectation.
OK, let’s not get too strict about it. Easy road.
Where does the future profit swing around the most?
Right at ATM. So that’s where time value peaks. (Important caveat: this does NOT mean total option value peaks at ATM. We’re only talking time value here.)
Now compare OTM vs ITM (still for a call). In OTM, the price has to move a lo~~~t upward before you scrape together even a tiny profit — and if it drifts downward? Total wash.
In ITM, sure, a big upward move is less likely, but if it happens you’re golden. And even if it drifts downward, there’s still room for some profit before things really go south.
(Reminder: we’re talking about time value here, not intrinsic.)
So, in the standard model (a call on a stock with no dividends, interest rates not negative), at the same distance from the strike, time value in ITM is bigger than in OTM!!!! (Far out of the money the time value shrinks to practically zero, but deep in the money it levels off at $K(1 - e^{-rT})$, the interest you save by paying the strike later; that’s zero only when $r = 0$.)
I’m just gonna plop dots on a graph. Just dots.
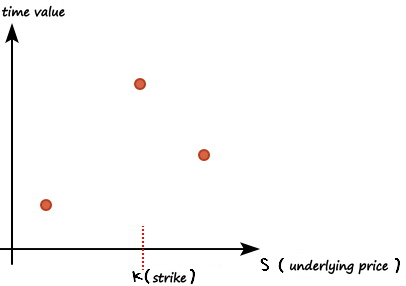
(y-axis is time value.)
I dotted the time value at each underlying price. ATM = peak, so the highest dot goes there. ITM > OTM in time value, so ITM dots sit a bit higher than OTM dots. Hence the picture.
Three zones, three sets of dots — and obviously these aren’t really discrete dots; they’re continuous in $S$. So let’s roughly connect them with a line. Not sure it’s actually a straight line, so let’s just say a curve. Vibes-based.
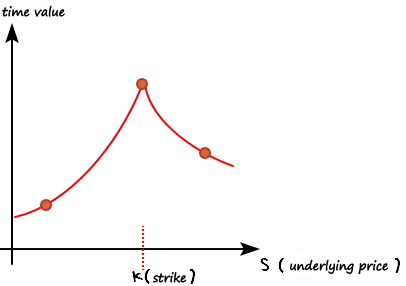
(I know, this might look a little sus.)
(In real life, you compute the total option value first using Black-Scholes, then subtract intrinsic value to get time value. So the “correct” order is: total option value → minus intrinsic → time value. I’ll come back to this.)
Anyway. What we actually want is a graph of total option value (intrinsic + extrinsic) against the underlying.

Like this — just stack the time-value bars on top of the intrinsic value graph from earlier!!!!!!!
Oh, and — one quick aside to tack on: the shorter the time left to expiration, the more time value bleeds away, little by little!!!!
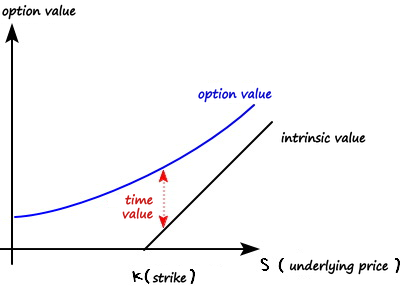
Even though I just hand-waved my way through time value, actually computing this stuff is… yeah… not exactly easy.
To spill the beans — the option value I sketched up there is what comes out of the famous Black-Scholes model (Black & Scholes option pricing model). You’ve heard of it, right..?! You crank out the total option value with Black-Scholes, subtract intrinsic, and out pops time value. (sob)
hehehe, normally a topic like this should wrap up nice and clean, but I just rambled forever… heh.
OK but — for us to actually try to compute this stuff with our bare hands, we need to simplify the model a bit first. Otherwise no calculation is happening.
And the simplified model is none other than… the Binomial Model!!!!!!
Continuing in the next post.
PS. When on earth am I actually going to write some code… (sob) lol
Comments
Discussion happens via GitHub Discussions. You'll need a GitHub account to comment.