Volatility
Breaking down historical and implied volatility — what they are, why we care, and how to actually compute historical vol from weekly price data in VBA.
OK so — volatility.
Why do we even care about volatility?
Because in the Black-Scholes model, the single sketchiest assumption is that “constant” volatility we just waved into existence. Like… what number do we actually plug in there?? We have to estimate it from something, and we’d really like that estimate to not be garbage.
So today: two flavors of volatility.
- Historical volatility — pulled out of the stock price data we already have on hand.
- Implied volatility — pulled back out of the Black-Scholes model itself.
Let’s hit historical volatility first.
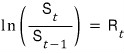
It’s a return-based thing. Daily return is

and we take the log of that as our raw material,
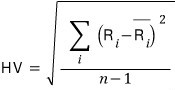
and the standard deviation of those numbers — that’s historical volatility.
(Why on earth are we taking the log?!?!?!? — Because the return is assuming continuous compounding. When we casually say “2% continuously compounded return”, we’ve been mindlessly slapping it into an exponential like $A \cdot \exp(0.02T)$, right? But now we want to recover that $0.02$ number sitting up in the exponent. So we kill the $e$, take the $\ln$, and that thing is our $R_t$.)
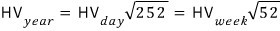
Once we’ve got that, there’s one more step — annualize it. And annualization is just: multiply by $\sqrt{\text{number of trading periods}}$.
So annual / weekly / daily volatilities are all linked like this:
OK, now let’s code this up — pulling HV out of given data.
First, the new VBA toys we’ll need. Arrays!
Dim arrayname() As Double— declare an array like thisReDim arrayname(1 To 3341)— and then size it like thisLBound(arrayname)— gives you the first index of the array (we’ll use this a lot)UBound(arrayname)— gives you the last indexWorksheetFunction.StDev(arrayname())— Excel’s stdev, fed the whole array
Alright, let’s throw some code down.
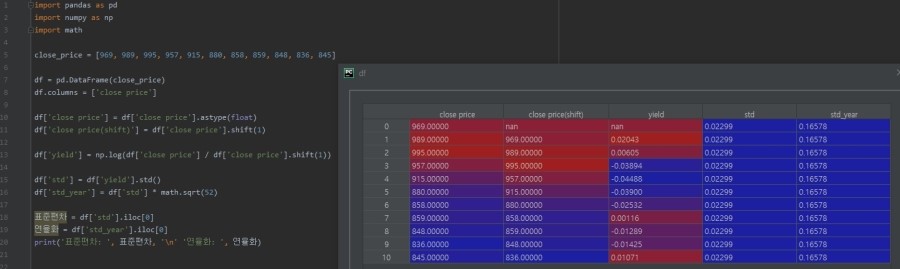
This takes a series of weekly closing prices and spits out HV.
Sub HV_vol()

Dim closeprice() As Double, yld() As Double   'declare some arrays
Dim i, stdev, yld_year As Double              'and a few numbers

ReDim closeprice(1 To 11)   'now actually size the arrays
ReDim yld(2 To 11)

closeprice(1) = 969
closeprice(2) = 989
closeprice(3) = 995
closeprice(4) = 957
closeprice(5) = 915
closeprice(6) = 880
closeprice(7) = 858
closeprice(8) = 859
closeprice(9) = 848
closeprice(10) = 836
closeprice(11) = 845        'done loading, now compute

For i = LBound(closeprice) + 1 To UBound(closeprice)   'from the 2nd entry to the last
    yld(i) = Log( closeprice(i) / closeprice(i - 1) )
Next

stdev = WorksheetFunction.StDev(yld())
yld_year = stdev * Sqr(52)

Debug.Print "standard deviation : " & Format(stdev, "0.000%")
Debug.Print "annualized : "         & Format(yld_year, "0.000%")
Code’s pretty chill so not a ton to say,
but — that line For i = LBound(closeprice) + 1 To UBound(closeprice). You could absolutely just write For i = 2 To 11 and call it a day. The reason I wrote it the long way is so it’s visible what’s driving the loop — you can see the array itself is the thing setting the bounds. Cleaner mental model.
Oh, and thank god Excel ships a stdev function, because otherwise we’d be over here squaring deviations and averaging by hand and… yeah. Phew. Saved.
(Plenty of questions are gonna be hanging in the air after this.
Like — is the Black-Scholes assumption of constant volatility even reasonable?? Isn’t volatility, by its nature, constantly shifting around based on recent data?? And historical vol just averages everything with equal weight — every day in the window counts the same?? Is that actually fine??
Yeah, there are other models that go after exactly these questions! But right now we’re sticking to the basics. The fancier models aren’t really harder, the plan is just to lay this foundation first and then keep building on it bit by bit. heh)
Originally written in Korean on my Naver blog (2016-10). Translated to English for gdpark.blog.