Aggregate Supply–Aggregate Demand Analysis
A deep dive into AS-AD analysis — tracing exactly what happens to equilibrium when M drops, G rises, or firms jack up their markup, step by step.
In the last post,
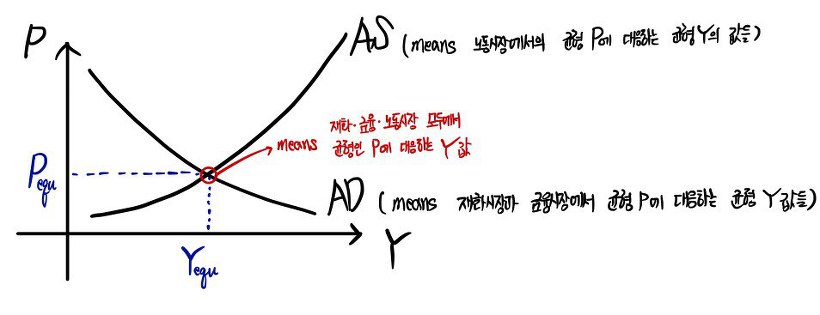
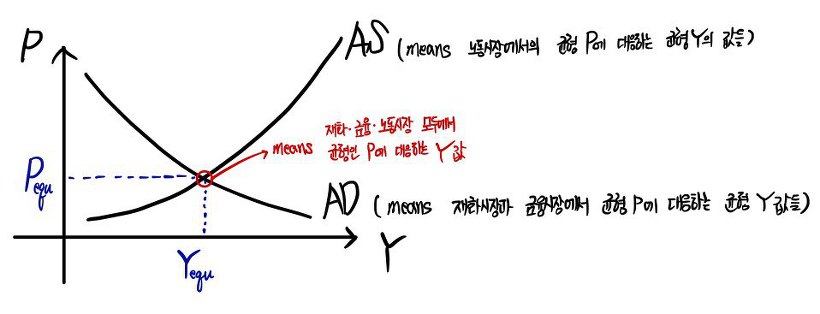
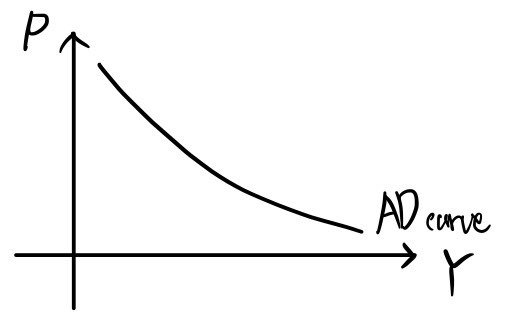
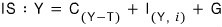
I derived the AS curve — the equilibrium in the labor market — and the AD curve — the set of points where the goods market and the financial market are both in equilibrium.
This time, I want to go really deep into:
what happens when the monetary authority changes M,
what happens when the government changes T or G,
and what happens when firms change their markup.
Why so deep? Because I can already feel myself about to forget all of this, so I’m going to drag in everything we’ve covered up to now and walk through it as carefully as I can.
Heads up though — to follow this post, you really need the logic from the previous posts down cold.
So this is going to end up being kinda half-review, half-pushing-forward.
OK, first let’s think about what happens when the monetary authority lowers M.
(Lowering or raising the money supply happens through open market operations, right? Right.)
Let’s start from a setup where everything had already settled into equilibrium.
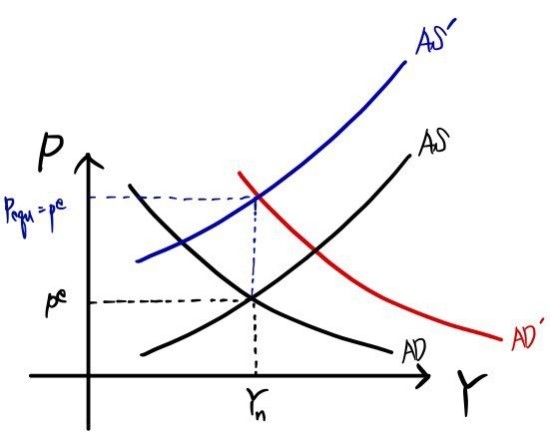
Say it’s a situation where P(e) = P(equ).
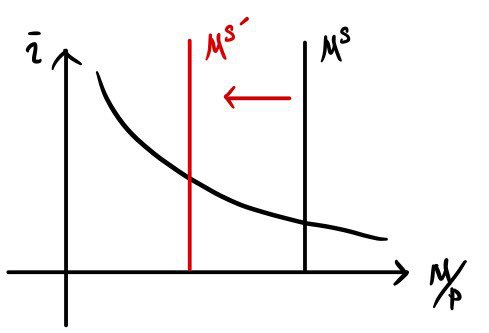
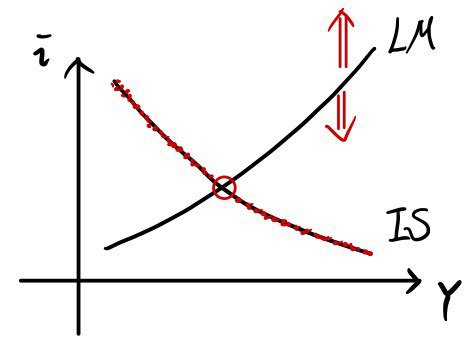
When M drops in the financial market, the interest rate gets pushed up like this, and
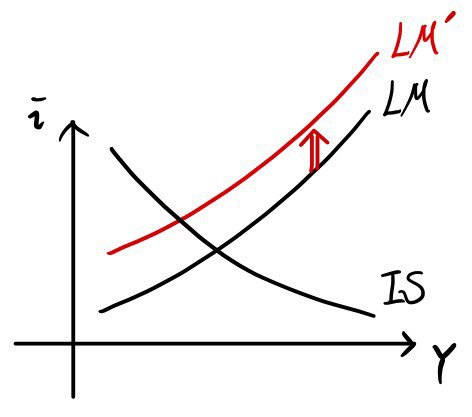
the LM curve shifts up.
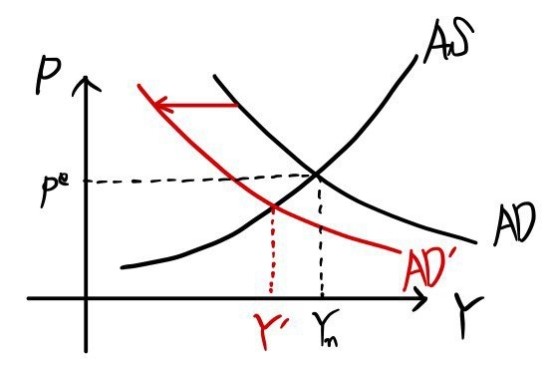
Which means the AD curve slides to the left, right?!?!?!!!!
Ohhh~~~~ look at that — a gap just opened up between Y’ and Y(n).
And from the last post, we said the AS curve keeps moving until that gap closes, right?!!!!
Why:
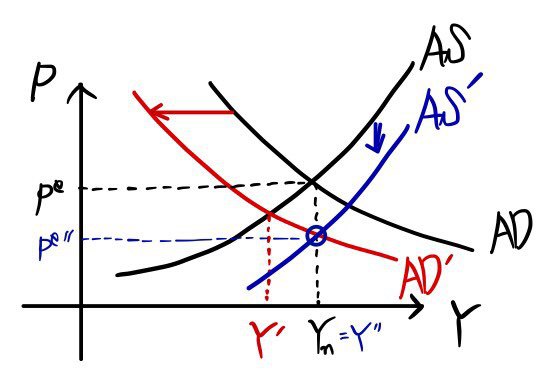
① People’s expected price level drops below P(e) → the AS curve comes down, and
② along with that, the price level itself slides along the AD curve,
and this keeps going until Y’’ = Y(n) — only then does the AS curve finally stop shifting.
The new medium-to-short-run equilibrium settles at a spot where the price level is lower than before, but Y is exactly where it started.
Now this time, instead of M, let’s say the government changes G.
We’re sitting smack at the medium-to-short-run equilibrium, and the government cranks G up.
When G goes up,

because of that,
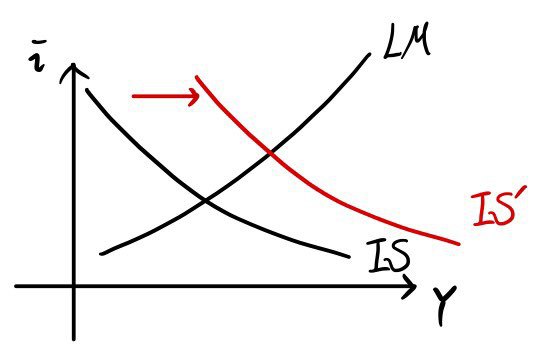
IS shifts to IS'.
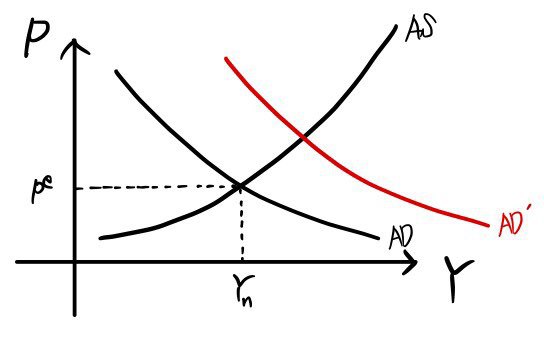
And so the AD curve shifts to AD'
(to the right).
Ohh~~~ moving like that, short-run output Y goes up and the short-run price level P goes up too.
And as the price level rises, people are like “Wait, WHAT?!?!?!! Prices went up!!!! Dammit!!!!! We’re getting screwed!!!!! Give us a raise!!!!!!”
So they bump up P(e), wages rise, and firms hike their prices!!!!
Which means the AS curve keeps shifting until Y = Y(n).
Until it lands here!!!~~~~
Third case — let’s say firms cranked μ (markup) up.
Why on earth would a firm raise its markup?
Just to squeeze out more profit????
If they jack it up for no reason they’d just lose to competitors, right?????? They probably wouldn’t raise it for absolutely no reason.
They’d raise it because they had to — and the classic unavoidable reason is something like “oil prices went up.”
Oil prices going up = costs going up for the firm.
If wages stay flat, the firm’s only move is to raise its markup.
But fine — let’s just imagine the firm goes nuts and hikes the markup anyway.
The reason it’s OK to read it that way is:
oil prices rose = markup rose = real wages dropped.
They all amount to the same thing, basically — so let’s just roll with it.
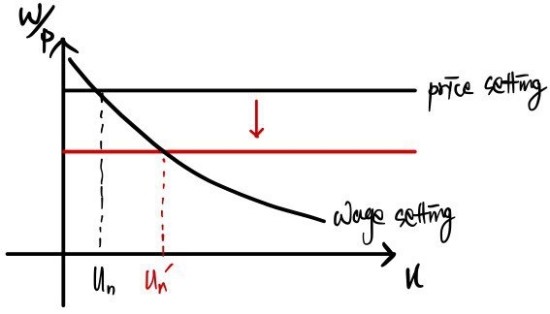
Bump the markup up,
and in the labor market (price setting, wage setting) that gives us the medium-run equilibrium,
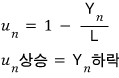
the natural rate of unemployment goes up.
What that looks like:
this.
Over in the AD–AS picture, when Y(n) drops, people’s expected price level is now sitting below the actual “price level,”
so people bump up their expected price level, and the AS curve shifts up.
The price level rises like this.
You could call this “cost-push inflation,” basically.
One more thing I want to wrap up before moving on — and it’s —
honestly it’s all stuff I already did, I just want to put it down as a summary.
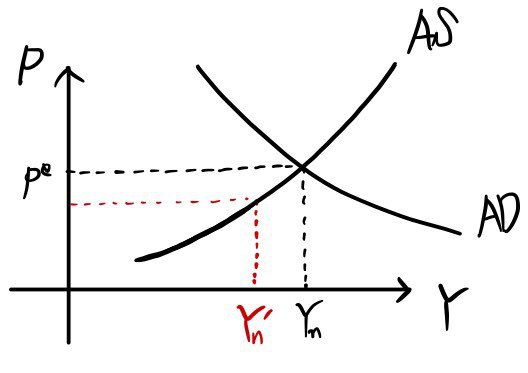
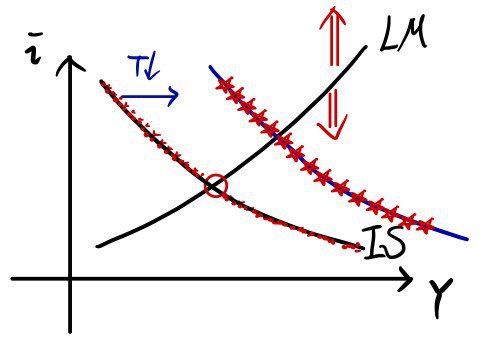
When the government messes with taxes or government spending, the IS curve moves,
and that drags the AD curve along with it,
so with an IS and LM that look like this, sliding P up and down,
the IS-LM intersection points you trace out,
i.e., the AD curve you get from those (Y, P) pairs,
let’s say it looked like this.
Now, the government drops T, so IS slides to the right!!!!!!
Because of that,
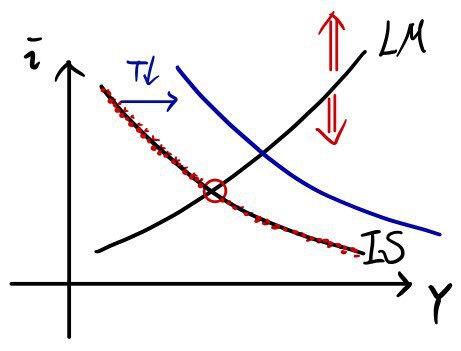
we slide it like this, then play with P from 0 to ∞ to grab the (Y, P) pairs,
and you get the (P, Y) pairs at the star-marked intersection points.
But hold on — since the ΔY at each of those individual points is the same,
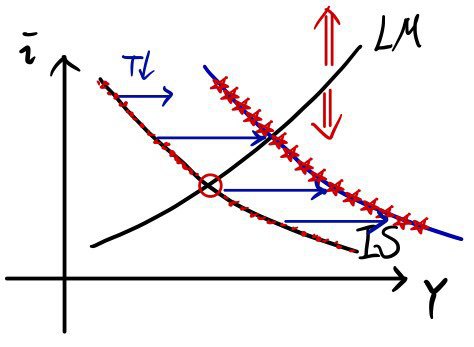
it kinda looks like you could just shove the whole AD curve to the right by that same amount.
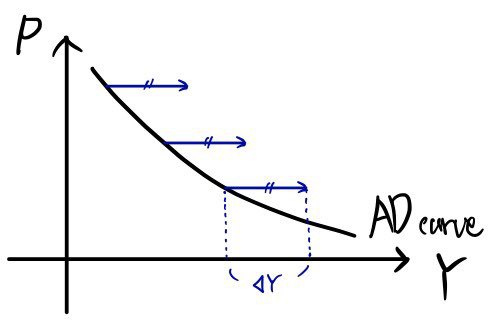
Plot those points again,
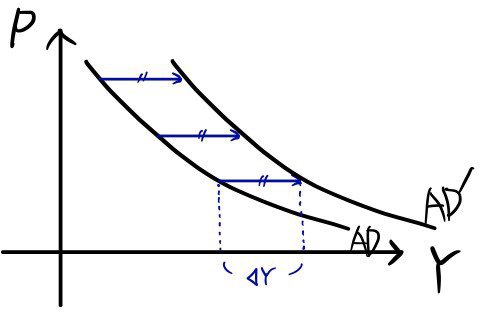
and — that’s the summary I wanted to jot down: “IS and AD curves move in the same direction.”
Originally written in Korean on my Naver blog (2016-01). Translated to English for gdpark.blog.
Comments
Discussion happens via GitHub Discussions. You'll need a GitHub account to comment.