Endogenous and Exogenous Variables
A fun, breezy breakdown of endogenous vs. exogenous variables — think exam scores, study hours, and yes, a girlfriend shifting your efficiency curve upward by h.
Quick housekeeping before we dive in: I want to lay out endogenous vs. exogenous variables.
You know how the maps we actually use don’t show every single thing in the world? They strip it down to the important stuff — roads, rivers, cities — and just… ignore everything else. Turns out economics is exactly like that. You keep the minimum number of variables you absolutely need, and everything else? Gone.
Reminds me of the line usually attributed to Einstein, “Mache die Dinge so einfach wie möglich — aber nicht einfacher”:
Make things as simple as possible, but not simpler.
As simple as possible. Just not any simpler. Hits, right?!!
(Or another way to say it: you assume a ridiculously~~~ simple model, analyze the heck out of it, and then add a couple of variables and slowly expand it from there.)
OK so — once economists have stripped things down to the bare minimum, what do they do next?
They split those variables into endogenous variables and exogenous variables!
So what on earth are endogenous and exogenous variables?!!!
Example. Let’s say we’re studying GD park’s “exam scores.” Most people’s first instinct would be to take “study hours” as the direct variable, right? Let’s throw it on a coordinate plane real quick —
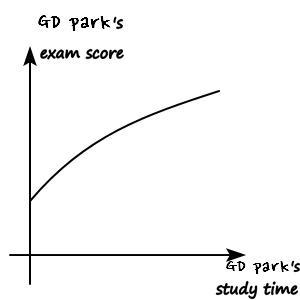
I mean — say what you will, but I am at least a human being, so the more I study, the higher my exam scores should turn out. Right???
(The reason I drew it concave is just my personal philosophy on studying, lol lol lol — don’t read too hard into it.. hehe.)
OK so — are we done with the analysis?!?!?!
Nope, not even close. Let’s also think about the other (meaningful) factors.
Like — let’s say a girlfriend appears. Studying 2 hours with no girlfriend vs. studying 2 hours with a girlfriend — let’s say there’s a difference in efficiency!!!! No girlfriend? Eh, kinda meh. But with a girlfriend you can study happy, so for the same number of hours the efficiency shoots way~~ up, and you get higher grades.
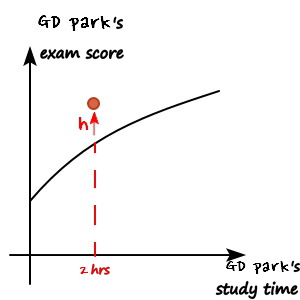
So compared to the original data, the score is now higher — the point needs to sit up here.
But hold on — would it really make sense if it only jumped up by h at the 2-hour mark?
No matter how many hours you study, let’s say the boost is the same h.
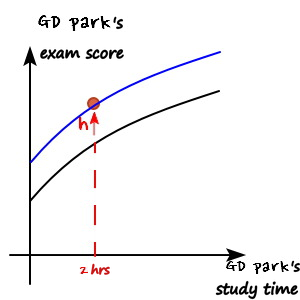
So the new function looks like the blue line — when a girlfriend appears, the curve parallel-shifts upward by h.
And conversely, you could think about when a cancerous lump of a girlfriend appears.
(In that case, you’d draw a curve parallel-shifted downward by h, obviously.)
Or as my income goes up (part-time raises, allowance bumps, all that…) the study efficiency could go up or down too…
OK. Here’s what I was actually trying to get at —
In this model, the exam score is the endogenous variable: it’s the thing the model works out. Study hours, and the outside factors — girlfriend, income, all that — are handed to the model from outside, so they’re the exogenous variables.
(Two notes. A change in study hours moves you along the curve, while a change in an outside factor like h shifts the whole curve. And study hours would only become endogenous in a bigger model that also explains how many hours you choose to study.)
Getting a bit of a feel for it?! Or was the example kinda weak — lol. Should I have gone with something more extreme, lmao? Anyway!!! heheheh heh heh.
This is probably stuff everyone already~ knows, so I kind of banged it out — just enjoy it if you do, and that’s enough for me.
Comments
Discussion happens via GitHub Discussions. You'll need a GitHub account to comment.