Indifference Curves and Utility Functions
We get into indifference curves and utility functions — why some baskets make you equally happy, and why piling on more stuff gives you less of a kick each time.
Picking up right where we left off in the last post.
No intro. If you’re curious, just go read the previous post and come back hehehe.
So. Say there are infinitely many baskets, numbered 1 through 99999999999999999,
and some person, no matter which numbered basket they pick,
says they feel “equally happy” about it.
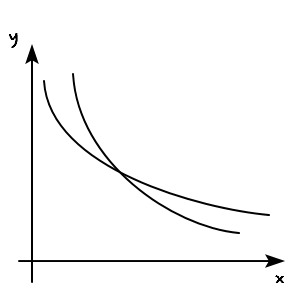
Now I tried to draw all those 99999999999999999999999 baskets as points on a coordinate plane.
(Pay attention to the axes.)
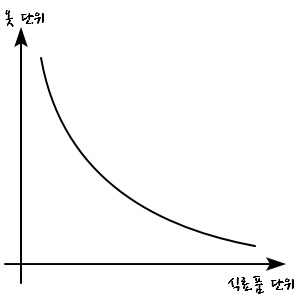
Wait — I said I was going to plot points, so why is this a line?????
It’s just that there are SO many points that it looks like a line.. ;_; lololol
Anyway, the shape of “baskets a person feels equally happy with no matter which of the 99999999999999999999999999 they pick” looks like that.
Whyyyyyyy????????
Let me try to explain it in my own way.
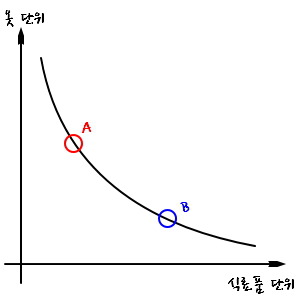
If I grab two points out of the many — call them A and B — and try to explain it,
why does picking basket A and picking basket B give the same happiness?
You’ve probably already noticed,
“Basket B has less clothing than A, but it makes up for it with food in (its own proportional way), so it’s all good ^^”
is what you’d say.
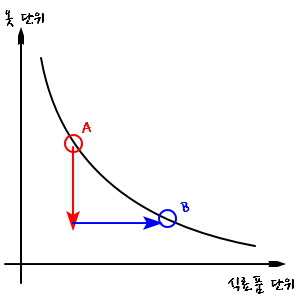
The reason I phrased it as “in its own proportional way” is
that when you plot out the baskets a single person feels indifferent across,
the slopes of the curves are different!!!
Why are the slopes different?
Because when one thing decreases, the other has to increase to make up for it,
and the ratio by which it has to increase is different for different people.
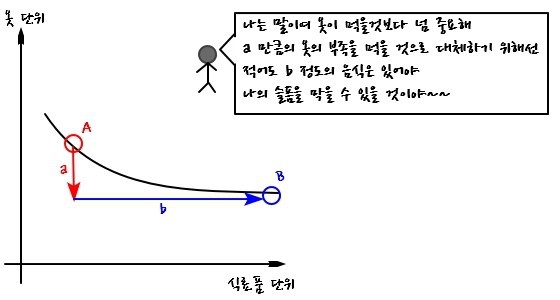
<This guy is all about looking sharp.>
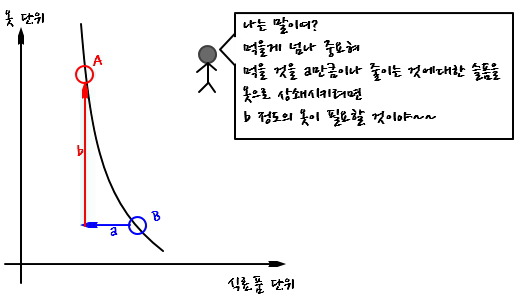
<This guy is gonna eat like a beast.>
Up until now I’ve just been saying “liking” or “preferring.”
But the thing that numerically represents this liking, this preferring, is called ‘utility’ (Utility).
So this time, we’re going to study the utility function.
Now instead of looking at two goods like above,
I’ll shift the camera onto a single good.
(We’ll bump it back up to 2 later.)
For everyone, the more you have, the better.
(This is a foundational principle of economics — obviously excluding stuff like excrement, filth, etc.)
For consistency I’ll go with ‘clothing.’ (I want lots of clothes too T_T)
But here’s the thing,
even though more is better
— that is, as the number of clothing items goes up, utility goes up —
because humans are fickle, the function for clothing
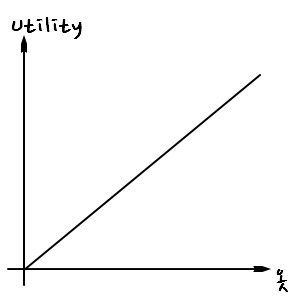
does not look like this.
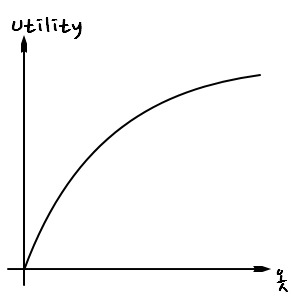
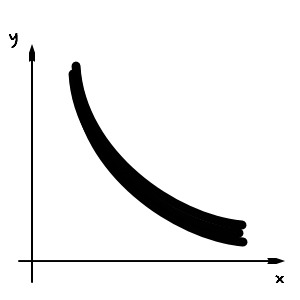
Human utility looks like this.
If we read the graph,
it’s saying this:
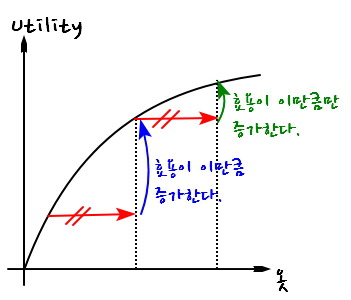
Comparing when you have a little clothing vs. a lot of clothing,
even with the same increase in clothing, the size of the utility bump is different.
So here’s what that means.
If you hand 100,000 won to a broke kid like me,
I’d be all “SQUEEEAAAALLLLL!!!!!!!!!!!!!!!!!!!!!!!!!!”
But if you hand 100,000 won to some loaded rich kid,
they’d probably toss it because it’s bad luck or whatever lololololololololololololol
You’re getting the sense of why I said humans are fickle, right!
Fickle humans… once they have a lot of something, they forget,
and once they’re sitting on a pile, even the same big increase doesn’t hit the way it used to.
This is exactly the “law of diminishing marginal utility,” but
to be more rigorous,
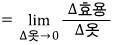
let me shrink the size of the increase down to an infinitesimally small ‘infinitesimal unit.’
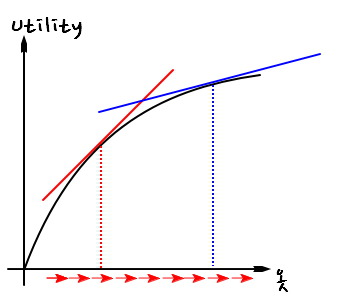
“Marginal utility” = “the ratio of utility increase to the amount of the increase”
<The increase in utility when one unit goes up>
So!!! marginal utility is what the derivative of the graph above represents,
and the law of diminishing marginal utility means that the graph
is one where the slope decreases as clothing increases!!!!
The textbook example of such a graph, mathematically, is

and that’s what we’re going to use.
So let’s just assume this.

But wait — would this only be the case for clothing?
The law of diminishing marginal utility should apply to food too,
so it doesn’t seem unreasonable to say food takes the same form.
That is, by assuming the same thing again,
now we expand back to 2 goods.

OK, when carrying these formulas around, writing them with the words “clothing” and “food” is annoying, so
clothing → x
food → y
let’s just go with that~~~
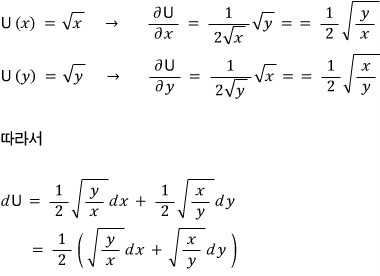
So so so so so

we define them like this,
and
So!!! the total utility function $U(x,y)$ comes out to be this.

Wow, ok hold on…… why exactly is the total utility function
defined as the product of the utilities of each good?!?!?!
It could be a sum,
or a square, or a cube, etc. — there are tons of options, so why specifically the product?!?!?!?!!!!
The reason is, a little later,
through some logic that I personally find pretty unsatisfying, we land on ’total utility = product of each utility.’
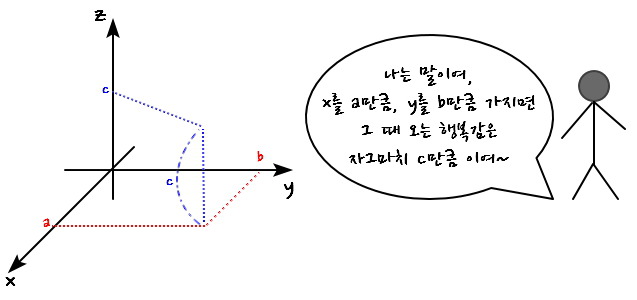
First, we need to interpret the two-variable function $U(x,y)$.
To keep the logic consistent with what we’ve been doing, I’ll think of $x$ and $y$ as “the number of units of each good.”
So picture it as the number of units of each good sitting inside the basket.
And here, instead of writing $U(x,y)$,
I’ll write it as $z$ and read it as ‘utility (happiness).’

The reason I’m doing that is because I want to draw it on a 3D coordinate axis.
When you’re drawing, $z$ feels nicer than $U$.
When I need to read it as utility again later, I’ll switch back to $U$…
(sorry for going back and forth hehehe)
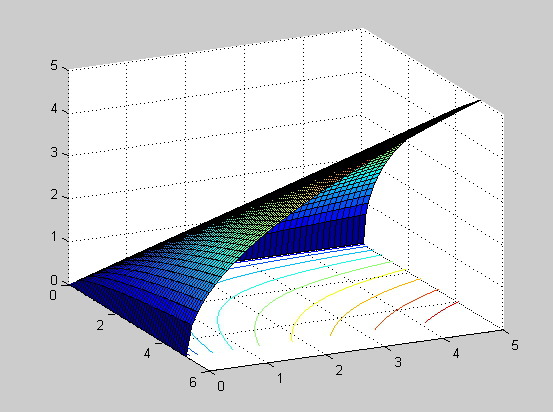
Look at this.
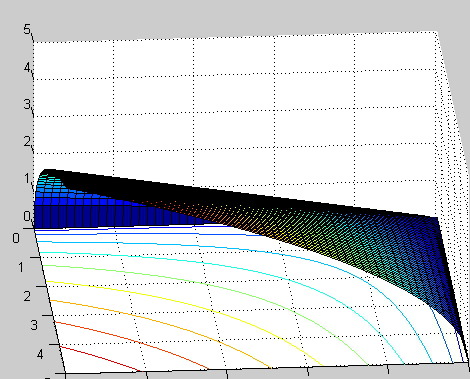

Plotted in MATLAB, it comes out like that.
I’ll explain “the line below the ground” in a sec.
First —
the height each point on the surface floats above the $xy$-plane
is exactly the utility (happiness) you get from picking that much $x$ and that much $y$.
Oh, and do you see the ‘indifference curve’ on this surface ($z=c$)?
The lines I projected down to the floor are the indifference curves,
and the same-colored lines on the surface….
that is, the set of points within the line at the same height on the $z$-axis
— those points form the indifference curve corresponding to each $U$ value ($z$ value).
If you understand the basic equation of a plane, the indifference curve falls right out of that,
so I’ll stop explaining here.
OK so now we’re going to look at

mathematically.
For the two-variable function $z(x,y)$, the change in the dependent variable $z$ is
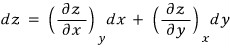
defined like this via partial derivatives.
So if we use the name $U$ for this function,
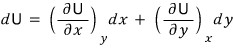
And
Oh ho~
Is the “law of diminishing marginal utility” baked into this expression?!?!?!?
Yes it is!!@@!!!
Why?

what this is saying is
“(with $y$ fixed) by how much does utility change as $x$ changes by this much~~?”
That is —

is the “marginal utility” of good $x$.
Now, here —
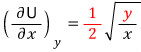
with $y$ fixed,
as $x$ gets bigger, this quantity gets smaller.

That is, marginal utility decreases!!!!!!!
One piece of corroboration is sitting right here.
“The utility function has to be of the form

with $0 < n < 1$”
is what it is.
If it goes above 1, the law of diminishing marginal utility no longer holds,
and the foundational principle of economics shatters — economic logic gets shaken at the roots.
So the exponent has to be less than 1.
Along with this, let me write a few more things about the indifference curve — the struggles to keep economic logic intact.

When both are positive, the indifference curve has a negative slope.
Every consumption basket lies on a unique indifference curve.
Indifference curves cannot intersect.
Indifference curves do not overlap.
Let me talk about #1.
#1 already showed up above.

The fact that this is positive means the consumer likes having $x$ and $y$.

means that
when $dx > 0$, $dU > 0$,
and the meaning of that is
when $dx > 0$: if you get more $x$,
$dU > 0$: your happiness changes in the positive direction.
That’s what this is saying.
Let’s hit #2.
First — the indifference curve is unique!!!!
If it weren’t unique, that would mean having more $x$ could make you less happy,
and it’d break the assumption that more $y$ is better too.
So the indifference curve has no choice but to be the one and only.
Why does it break if it’s not unique?
Let’s say (2 units, 4 units) could give you 2 different utility values.
If it’s not unique like that, you wouldn’t know what’s better and what’s worse.
So the moment you assume ‘unconditionally, more is better,’
you’ve already assumed the utility function has to be unique.
Third —
Since indifference curves can’t be two, they can’t intersect!!
Hypothetically,
if two different utility functions crossed each other,
if two different utilities overlapped like this, what logic breaks?
If all the points on these two curves give
the same level of satisfaction to a given person —
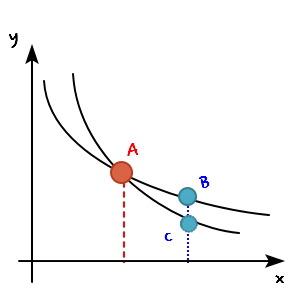
let’s say this person was sitting at satisfaction level A,
and then moved to either B or C.
The thing is, it doesn’t make sense for them to feel the same satisfaction at both B and C.
When this person is holding the same quantity of $x$,
does it really make sense that they feel the same satisfaction holding a $C$-amount and holding a $B$-amount? hehehehe
What kind of split personality is that lol
And then, fourth —
#4 is the same vibe as #3.
‘Can’t intersect’ leads to ‘don’t overlap.’
That is, the indifference curve must not have any area.
That they don’t overlap like this!!! — by running the same argument we used for #3,
I’m pretty sure we can prove “this is not allowed” too.
So I’ll move on.
Move on? Then we’re done lol
In the next post I’ll push further,
but anyway, to recap —
the utility function, for each utility $U_1, U_2, U_3, \ldots$ and so on,
is drawn like the projected lines below,
and from here on, unless something weird comes up, I’m going to draw stuff assuming the utility function below.
ok cool.
This was a kind of rough-and-ready post,
so if you have any leftover questions, drop them in the comments.
P.S.
Did you know?
All my blog posts have been converted to PDF,
and I’m selling the PDF materials :-)
https://blog.naver.com/gdpresent/222243102313

Blog post PDF (ver.2.0) for sale (Physics and Finance I studied)
Purchase info is at the link~ Hello! If there are parts of the blog posts that feel unsatisfying, too much…
blog.naver.com
Originally written in Korean on my Naver blog (2016-07). Translated to English for gdpark.blog.
Comments
Discussion happens via GitHub Discussions. You'll need a GitHub account to comment.