Utility Maximization with Savings and Loans
We tackle the last weird budget line — loans let you borrow against next year's income, savings stack up interest, and the slope ties it all together.
So we’ve been grinding through “weird budget lines” — how to max out utility when the budget line is shaped funny.
The weird ones we’ve hit so far looked like this:
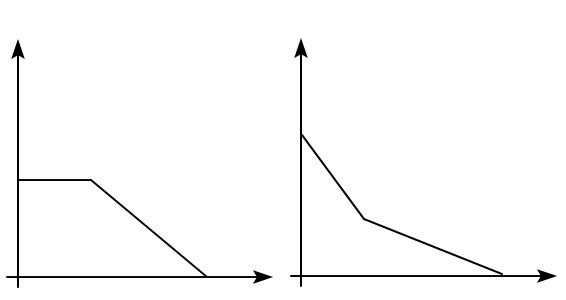
Stuff like that.
This time? It’s the last weird budget line. What kind?!?!
…I’m not telling. heh hehehehe.
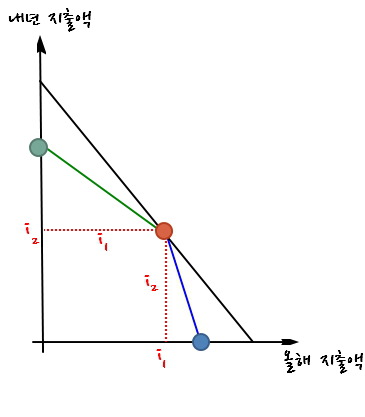
OK, let me set up the axes first. Here’s what x and y are:
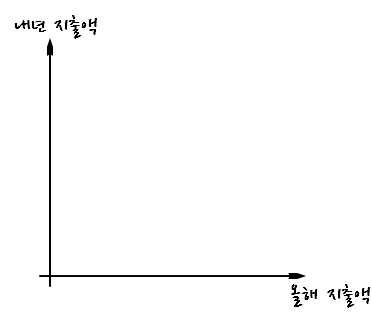
Like that.
And there’s some dude planning his consumption across this year and next year.
His income this year is

His (expected) income next year is

Cool.
So,
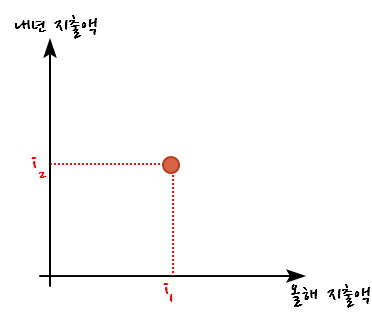
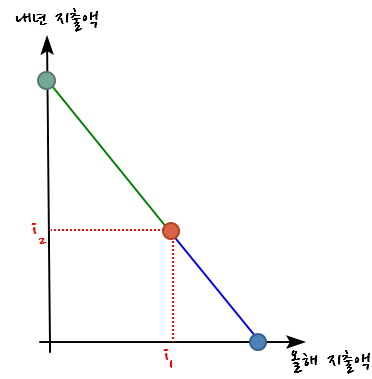
this red dot is the totally natural one to plot. Right? Yeah.
Picking the red dot is the most boring, ordinary choice you could make. Spend everything you earn this year, this year. Spend everything you earn next year, next year. Done.
But — that’s not the only thing he can do.
Because loans exist.
There’s a way to bump up this year’s spending.
Like this:
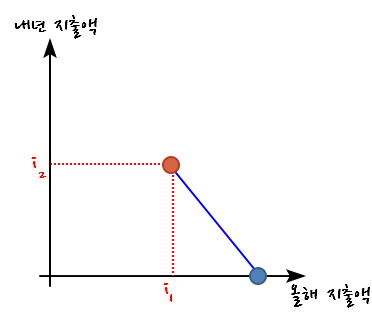
You shift in the +x direction — but since you have to set some aside next year to pay it back, next year’s spending drops. So we draw a downward-sloping line like that.
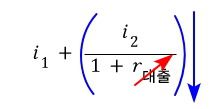
Now, that blue dot sitting at the x-intercept — what’s its value?
It’s

Why??
The max you can borrow is

this much. heh.
Why?!?
If you borrow

this much,
then after 1 year the interest is

and principal + interest becomes
Right? Because that’s just how it works.
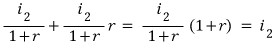
So the math says: the money you borrow

this year turns into principal+interest $i_2$ next year.
(I’m explaining present value of $i_2$ the easy way here. Just think of it as present value — present discounted value.)
(Also — if someone actually picks the blue dot and consumes like that, you have to assume they’re either a terminally ill person checking out next year lol, or a guy who genuinely only lives for today. 0 won next year?? lol)
OK OK OK OK now now now — is that all his options?
Nope.
You can also spend less this year and more next year.
So this is also possible:
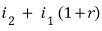
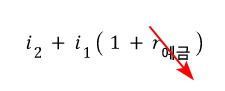
And now the green dot up there at the y-intercept — let’s think about that one.
It’ll be

That is: next year’s income

plus this year’s income

plus the interest you’d earn on this year’s income

all stacked together. So it works out to
~
OK so what’s the slope of this thing??!
Whether you compute the slope from the lower-right triangle or the upper-right triangle, either way you get

~
Ohhh, so in this kind of case the budget line is just that?!?!
BZZT. Wrong.
Because the bank’s loan rate and deposit rate aren’t the same.
Banks gotta eat — they live off the loan-deposit spread.

So we don’t actually draw a straight budget line.
It comes out like this~~~ hehehehe.
Yep, the x-intercept shrinks.
Yep, the y-intercept shrinks too.
(Of course, the gap between the two rates is a relative thing — so you could equally well pretend one stays put while the other moves. Doesn’t change the conclusion at all, so whatever.)
So the budget line ends up shaped like this:
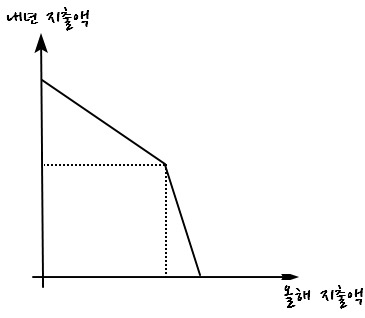
That’s the punchline.
Slap a utility function onto this budget line, find where it’s tangent, and read off the max utility plus the ordered pair (this year’s spend, next year’s spend) at that point — piece of cake.
So I’ll skip it haha.
…actually no — I’ll come back at you with it as a practice problem!!
And the whole takeaway from this post: just knowing there’s also a budget line that looks like that~~~~.
Originally written in Korean on my Naver blog (2016-07). Translated to English for gdpark.blog.
Comments
Discussion happens via GitHub Discussions. You'll need a GitHub account to comment.