Backward-Bending Labor Supply Curve
As wages rise you work more — until you don't: here's why the labor supply curve bends backward once you'd rather enjoy your money than grind 24/7.
Today we’re looking at “the choice between labor and leisure.”
Everyone gets 24 hours in a day.
Say the minimum wage is set at 10,000 won per hour.
Humans, by their own choices, decide how much of that to spend working vs. not working. (So “leisure” here just means “all the time you’re not working.” Sleep counts as leisure too. Whatever — the point is “hours worked” anyway, so it doesn’t really matter.)
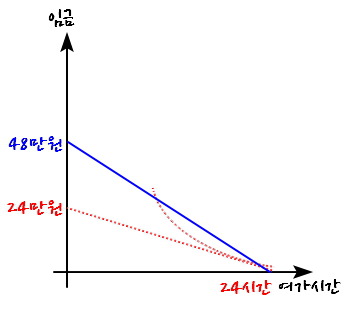
On these axes, let’s look at the set of ways a person can split up their time —
i.e., the choices on the table.
The y-axis? That’s the payoff for the choice you make.
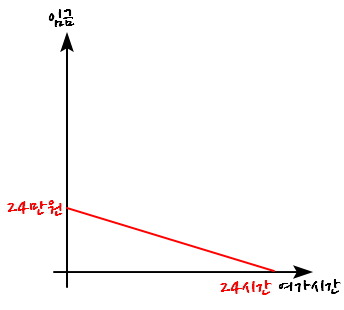
Drawn like that. Read off the x-intercept: “if you work 0 out of 24 hours, you make 0 won.” Read off the y-intercept: “if you take 0 hours of leisure out of 24 — i.e., you work all 24 — you take home 240,000 won.”
Then there’ll be some utility function over leisure-time vs. the money you get for giving up that leisure,
and you pick the point that maximizes that utility.
OK now let’s say minimum wage doubles to 20,000 won/hr.
Then the menu of choices looks like this.
Out of all those infinitely many combinations, this person will pick the utility-maximizing one — and the decision shakes out something like this.
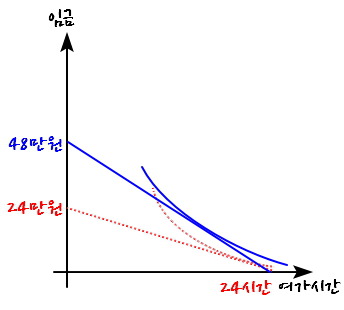
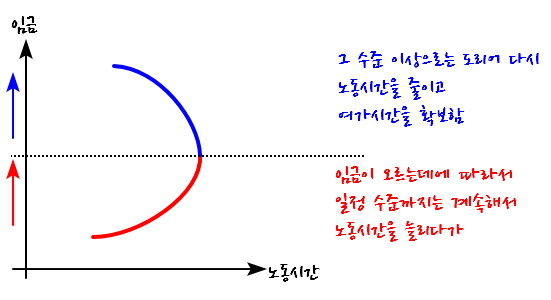
The idea that “wage goes up → I cut leisure and work more” doesn’t sound crazy at all.
Because if someone tells you you’ll get paid more, most people are gonna work more hours.
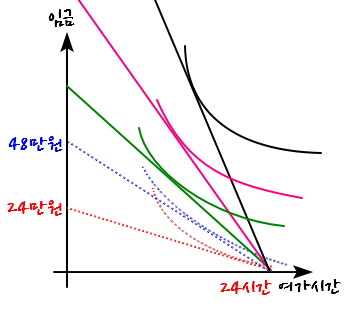
But — as wages keep climbing and climbing, will humans just keep slashing leisure and stacking work hours forever??? Anyone here willing to work 24 hours straight at 100 million won per hour, raise your hand.
Oh, even at 500 million won per hour you’d grind 24 hours straight??? Wouldn’t you rather work just a little bit and enjoy the leisure with all that money you made??? lol
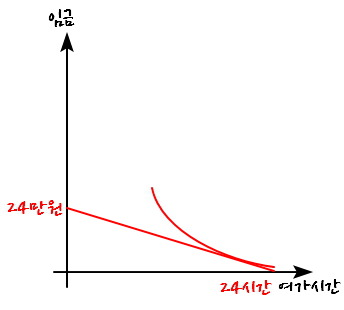
Let’s look at it on the graph! 👇
Ahh… this is a graph I drew myself to fit my point, so it kinda looks like it lacks credibility. Let me grab one from a textbook. 👇
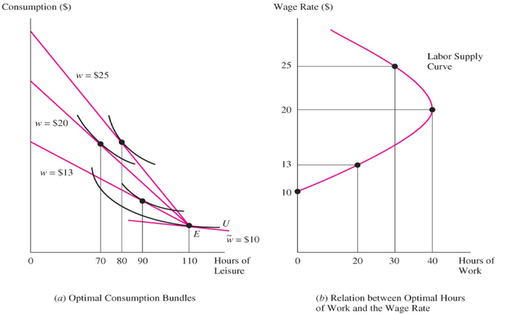
(Source: http://www.massimoanelli.com/teaching.html)
Apparently the empirical studies back this up too.
OK so, if we connect all those individual solution points on the graph above with a line — exactly like the picture above —
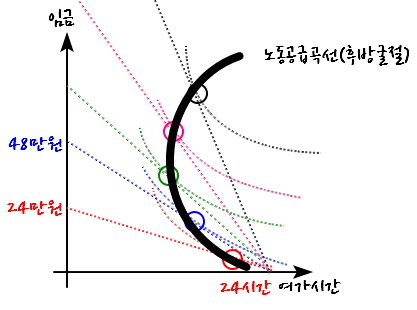
we get something like this, and that line is called the labor supply curve. heh heh heh hahaha
Right, so even reading it off the graph, we can see that as wages keep rising, at some point humans start increasing their leisure time again. (Of course, you need an actual model — i.e., a utility function — for this, but… heh)
Now, at each tangent point that maximizes utility, we read off “hours worked” & “wage at that point”
and transfer them over and plot them here,
Eeeeeehhhhhh
Wait, this kinda feels like it can be explained with the same logic as inferior goods??
Good x and good y — when your income rises, which one do you cut and which one do you bump up? → that was the inferior goods explanation. Something like that, right.
So, leisure time vs. money — which do you pick~~!? → that becomes the explanation of the backward-bending labor supply curve. Feels like that kind of framing actually works as an explanation, right???!!!
In other words: the move is to split this into the substitution effect and the income effect. (I’d really appreciate it if you’d take a look at the post right before this one on ‘substitution effect and income effect.’)
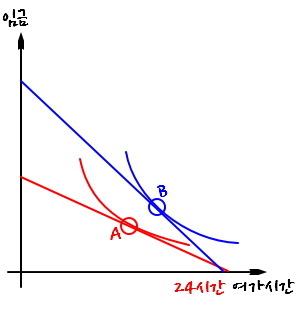
Let’s look at the case where wages go up and, as a result, leisure time also goes up. (With this we can explain everything, including how the backward bend shows up.)
First, the substitution effect. Draw a line with the same slope as the outer budget line, tangent to the inner utility curve.
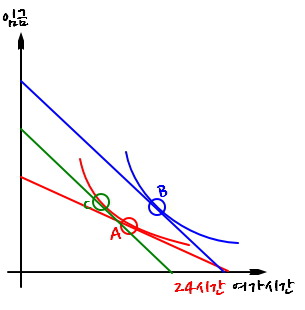
It’s clear that when wages rise, people cut their leisure. (A → C) But — the income effect… here, the “effect of having more time”??? — because of this “more time” effect, the extra time that gets created ends up going into more leisure, and the time added (+) this way is bigger than the leisure time taken away (-) by the substitution effect — so on net, more time gets dumped into leisure. 👀
Wow, that’s actually pretty interesting. heh heh heh (One thing I’m slightly worried about: I used the phrase “effect of having more time” and I’m not 100% sure it’s the right framing.) (If you’ve got a cleaner way to phrase it, please let me know.)
So really the point here is the same as before: when the “negative income effect” overpowers the substitution effect, the labor supply curve bends backward. 👈 I haven’t gone deep into the details here. That’s because the previous post covered it so painfully thoroughly that I was worried doing the same thing back-to-back would be brutally boring. So please read this one alongside the previous post. 🙏
Originally written in Korean on my Naver blog (2016-07). Translated to English for gdpark.blog.
Comments
Discussion happens via GitHub Discussions. You'll need a GitHub account to comment.