Market Demand and Network Externalities
We stack up individual demand curves to get the market demand curve, watch it flatten under perfect competition, then kick off network externalities with real-life examples.
Nothing crazy here, so let’s burn through it quick.
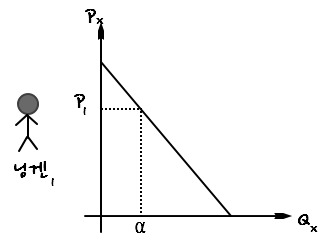
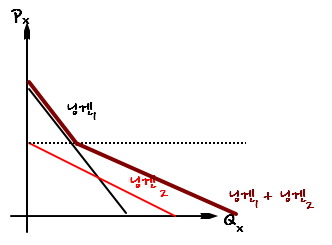
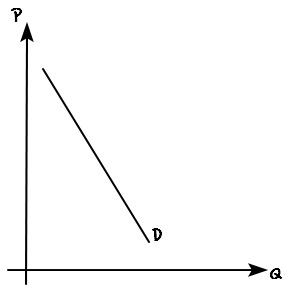
OK so let’s say person_1’s demand curve looks like this.
(Which, of course, came from person_1’s utility function and budget line. We did all that already.)
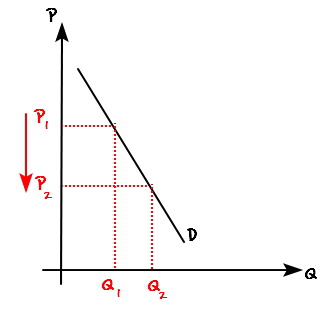
If good x is going for $P_1$ in the market, this person says they’ll buy $\alpha$ of them. heh.
But let’s not stop there — let’s go interview someone else too.
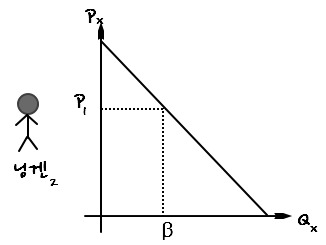
This guy says he’ll buy $\beta$ units of good x at $P_1$.
So now, with only persons 1 and 2 in the market,
if good x sells at $P_1$, total quantity sold = $\alpha+\beta$.
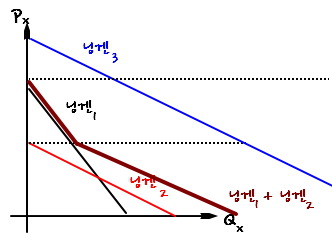
But hold on — the real market doesn’t have just 2 people. It has a crazy lot of people, right????
So at price $P_1$, the quantity sold is going to be $\alpha + \beta + \gamma + \delta + \dots$ units.
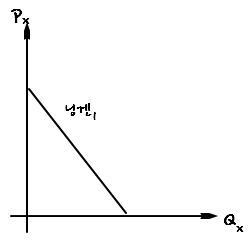
Now let’s flip this around and look at it through the demand curves.
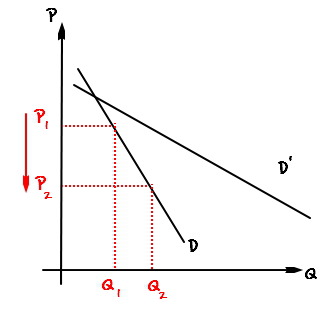
Market demand curve when only person 1 is in the market.
Then market demand curve when persons 1 and 2 are in.
Let’s just stack it up step by step, like that.
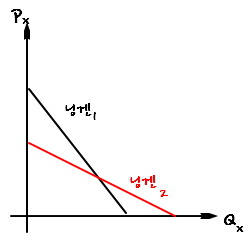
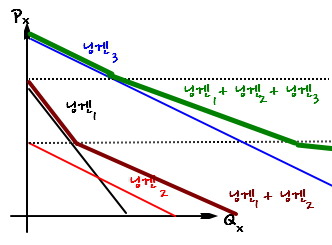

So that’s how it goes, apparently.
And the more people you pile in,
the flatter the total market demand curve gets — gradually, gradually —
and what this is telling us is:
“In a perfectly competitive market, the demand curve goes completely flat.”
Meaning, no matter how much the supplier dials supply up or down,
the market price doesn’t budge…. that’s apparently what it means… heh.
We’ll come back to perfectly competitive markets properly way, way later — for now let’s just lay this groundwork down and move on. heh.
Also — the fact that the curve flattens as more people enter the market
means, flipping it, that it steepens when people leave the market.
Mhm mhm.
This connects to network externalities.
People say don’t mix this up with external economies / external diseconomies — there’s a small but real conceptual gap.
So, kicking off with the definition of network externalities:
“A consumer’s demand depends on how many other people are buying the same good…. on….”
You know what, forget it. Let me just give you an example.
Like — when you start a blog, do you use Naver Blog? Or Daum’s Tistory?
The reason I write on Naver Blog is because Naver has 80% of the portal market share.
“How many people use it” affected my demand.
(Wouldn’t Megafile’s demand work the same way? The more people — i.e., the more uploaders — the more people sign up and shell out cash.)
Here’s another one.
The first thing I check when I’m thinking about signing up for a gym
(at least, in my case) is how crowded the place is.
If a ton of people use it, the odds that someone’s hogging the machine for whatever body part I’m hitting that day go up,
so I tend to scope out the member count rather than the facilities, as much as I can.
This one too — the quantity other people are demanding affected my demand. heh heh.
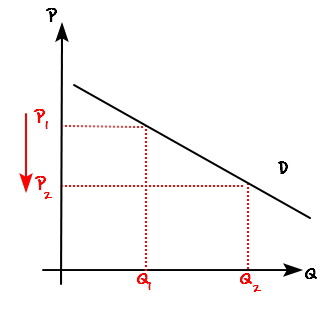
Alright, say this is the demand for Megafile.
And say Megafile drops its usage fee.
Price dropped from $P_1$ to $P_2$, and because of that price drop,
demand goes up from $Q_1$ to $Q_2$.
Whoa?!?!? It went up?!??!
Then I wanna sign up too!!!!!!!
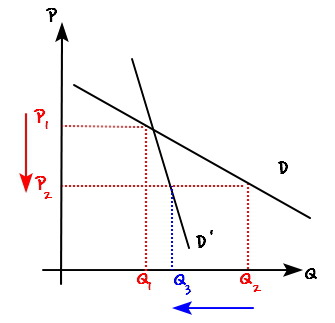
People like this keep piling on, so the D curve rotates flatter,
and that effect changes the demand curve.
Say the demand curve ends up looking like this.
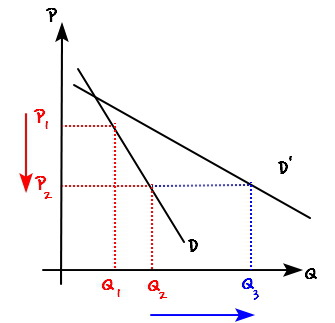
Ugh, so then the market traded quantity climbs from $Q_2$ to $Q_3$.
That extra chunk that just got tacked on is called the bandwagon effect,
and the fact that this effect showed up means??????
It means there’s a $(+)$ positive network externality.
(Bandwagon: literally the band’s wagon. So when a wagon rolls in carrying a band and people go “wahhhhhhhh~~~~” and chase after it — that’s where the name “bandwagon effect” comes from. Kinda hits different once you know that, right? heh.)
Now let’s check the gym example, which had network externalities running the other way.
The gym demand looked like this — but say the gym owner suddenly drops the gym usage fee
from $P_1$ to $P_2$.
Then sure, the number of users goes up from $Q_1$ to $Q_2$.
But someone gets annoyed at the new crowd and just bounces.
So the demand curve gets a little steeper,
and as a result, out of the users we just gained,
a chunk equal to $Q_2 - Q_3$ peaces out — and that drop is called the snob effect,
and the existence of the snob effect means
there’s a $(-)$ negative network externality.
Originally written in Korean on my Naver blog (2016-07). Translated to English for gdpark.blog.
Comments
Discussion happens via GitHub Discussions. You'll need a GitHub account to comment.