Isoquants: The Uneconomic Region of Production
That weird backward-bending chunk of the isoquant has a name — it's the uneconomic region, and here's exactly why it exists and why no sane firm would ever go there.
Last post,
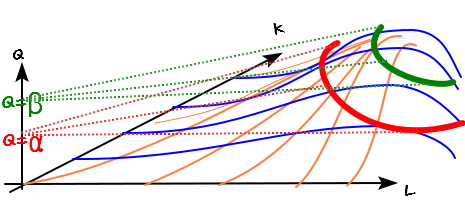
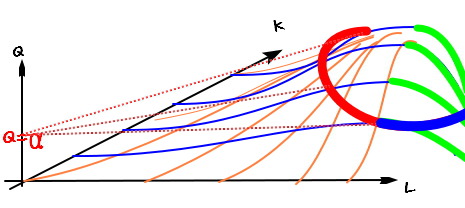
I drew this thing
and said, OK, let’s pop our eyeballs above it and look straight down~~~
When you look at it from up there,
I said it ends up looking like this.
And right here, you’re gonna squint at me.
Huh??????????????
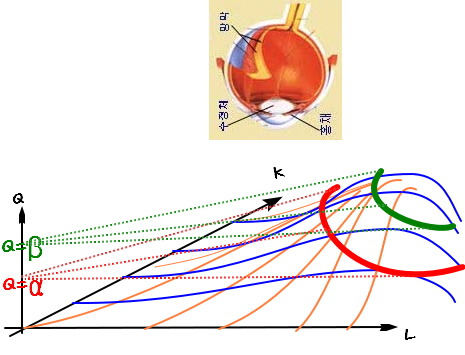
Not that — shouldn’t it be
THIS?!?!?!?!?!?!??!?!?
Yes yes yes yes yes — that’s correct.
That one over there is the right one @@@@
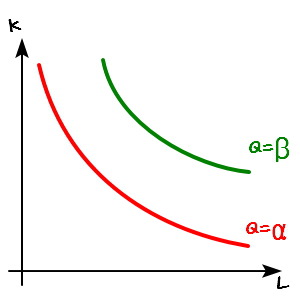
OK so, instead of putting two of them down, let me work with just one line, and slap names on a few specific points so I can actually talk about what’s going on.
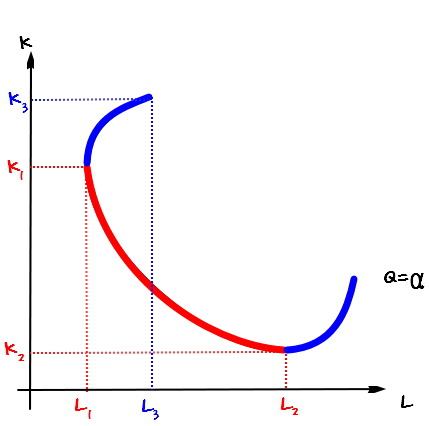
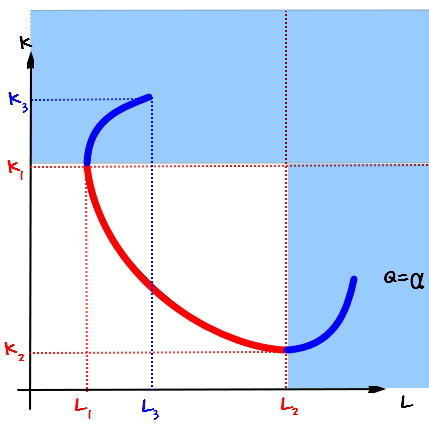
I’ll explain with this picture.
Among the isoquants here, look at the leftmost extreme point of the red one —

this guy.
Right now, our firm is using $L_1$ worth of L and $K_1$ worth of K, and cranking out output $Q = \alpha$.
From here, let’s bump K up past $K_1$, all the way to $K_3$.
With that $K_3$, how much L do we need to throw in to still produce the same $Q = \alpha$ as before?
The answer is: we have to use $L_3$, which is more L than the original $L_1$, just to crank out the same $\alpha$ we had before.
Wait wait wait. We just increased K, and yet to make the same amount of output we also have to increase L….??
On the flip side,
let’s look at L going from $L_1$ up to $L_2$.
When L goes up, K can come down a notch and we still get the same $\alpha$ — right??????????????
But that blue chunk is saying ’nope, you have to crank up both of them just to break even,’ isn’t it?????????????
That’s insanely inefficient, right????? Who in the world would make a choice like that???
Ah @@@@ you say inefficient??@?@?@
Why does this inefficient stretch even exist in the first place. We gotta go back and look at how the isoquant was born.
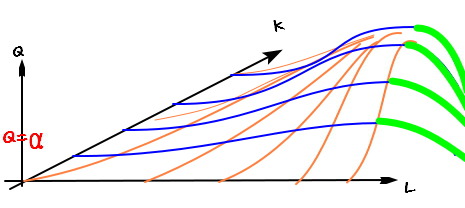
We pulled the isoquant out of this kind of coordinate space, remember?!?!?
Hold up @@@@
That light green stretch???!?!? What was that thing again??@?!?!?!
Yes yes yes yes — that was the part where humans get ’too’ numerous, which causes a negative efficiency change, and that
cancels out the efficiency boost from adding more humans, so $\Delta Q$ ends up negative —
that’s what we figured out with this picture @@@@
Ah, but —
when $Q = \alpha$, we grabbed all the points that share the same Q value and dragged them out as a line,
and that line is the isoquant,
since we yanked it out like this,
Ohhh, I see~~~~

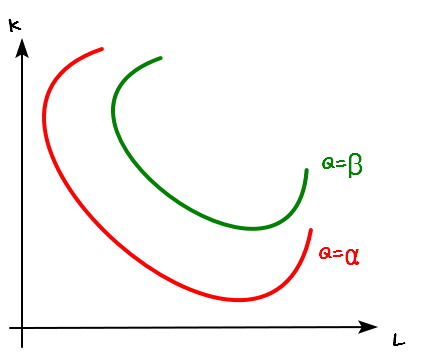
that weird “inefficient stretch” showing up in blue here
is the same thing as the light green chunk in the picture up above,
so it ends up looking like this @@@@@@
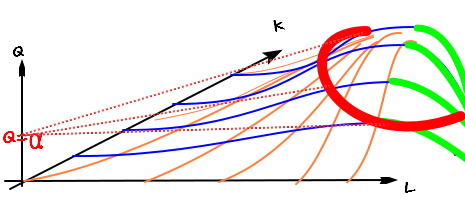
OK so, that blue chunk actually has a name — it’s called the “uneconomic region of production.”
What kind of CEO is gonna pick an L, K combo from the uneconomic region.
Simple version:

past a certain amount of L,
if you throw even more labor in, output actually drops,
and yet — is there any CEO out there who’d hire even more L??????????????
Raise your hand once heh heh heh heh
Yeah, nobody heh heh heh heh heh
There’s nobody who’d voluntarily go do something inefficient.
So,
that blue-colored chunk is called the “uneconomic region of production” :D
So~~~
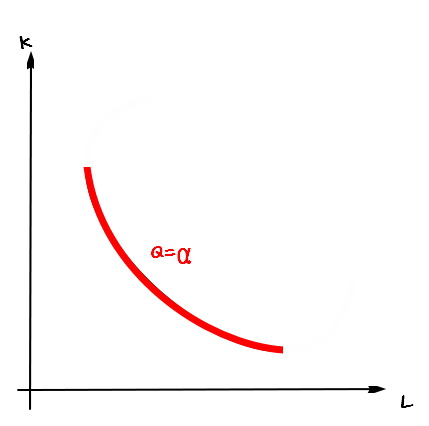
when we draw an isoquant,
we just erase the uneconomic region of production and only draw the economic region.
Because nobody’s ever gonna pick that area,
and that stretch isn’t something economists care about anyway @@@@@@@
So they say you just need to draw it like this~~
Yay hoo hoo
Originally written in Korean on my Naver blog (2016-07). Translated to English for gdpark.blog.
Comments
Discussion happens via GitHub Discussions. You'll need a GitHub account to comment.