Technological Progress
We sort technological progress on the K-L plane into three buckets — labor-saving, capital-saving, and neutral — by comparing MRTS slopes on isoquants over time.
This time we’re tackling “technological progress” on the K-L plane.
Let’s just get a feel for it first.
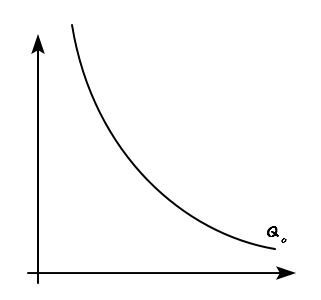
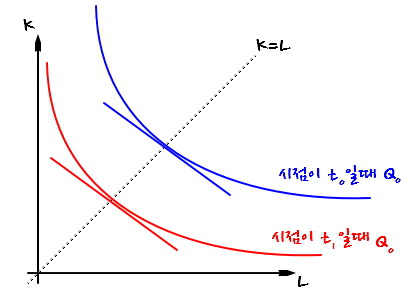
Say these isoquants are the (L, K) points that cranked out output $Q_{0}$ at time $t_{0}$.
Now time passes. We’re at $t_{1}$.
Technological progress would’ve happened, right?
If tech progressed, then with less input than the old (L, K), we can squeeze out the same $Q_{0}$ —
makes sense, yeah?
And if we throw in the same (L, K) as before,
we get more than $Q_{0}$ —
we get $Q_{1}$.
That makes sense too.
So,
the isoquant at $t = t_{1}$ is going to look like this.

OK so what we’re learning here is
how to sort technological progress into 3 buckets like that, and
how to read each one — that’s the goal of this post!!
We’re comparing $t_{0}$
with $t_{1}$,
and any time you compare two things, you need some kind of standard.
The standard here? “When L and K go in at the same ratio.” That’s the rule!!
Alright, here we go!!
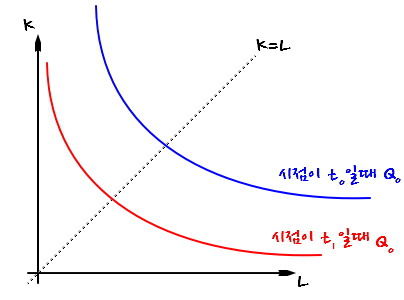
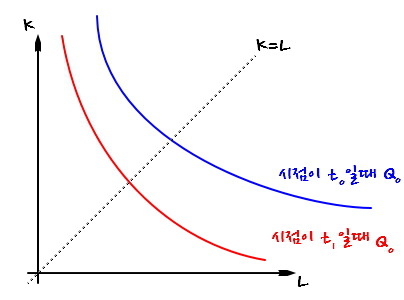
At time $t_{0}$,
the $Q_{0}$ isoquant is the blue curve below, and
at $t_{1}$, let’s say it morphed into the red one above.
How did these guys actually pull off the technological progress?!?!
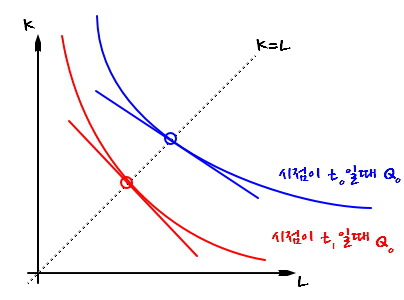
Since “L and K input at the same ratio” is our standard, I drew the line K = L.
Then at each intersection with K = L, we’ll compare via the MRTS — see how the progress shook out.
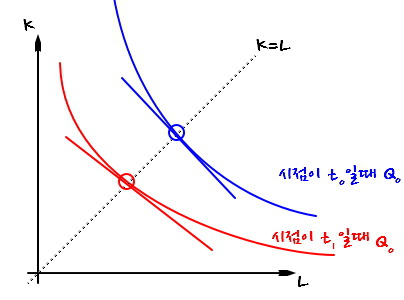
MRTS is just the slope at that point,
and we can read off technological progress by comparing the two slopes.
Going from the blue slope to the red slope, we’ll say “efficiency has gone up.”
Focus on this: “it went from the blue slope to the red slope.”
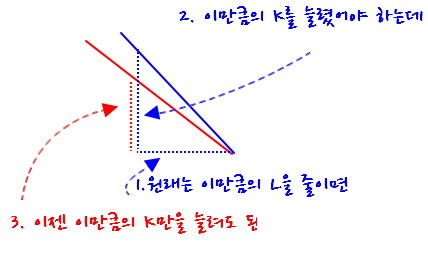
Something like this would’ve gone down.
Which means the efficiency of K has improved, right?!
Which means the tech that substitutes for labor — your machines, your robots — has gotten better.
So you don’t need to hire as many humans anymore.
This kind of technological progress is called “labor-saving technological progress.”
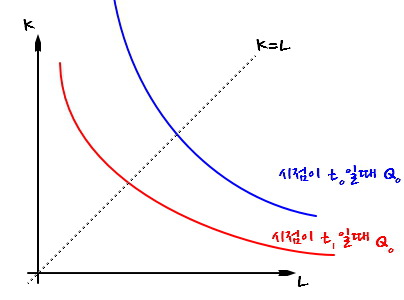
OK now let’s also think about the case where the isoquants at each time look like this instead.
Draw the slopes here too,
and compare them.
(Same drill — focus on the fact that it goes blue → red.)
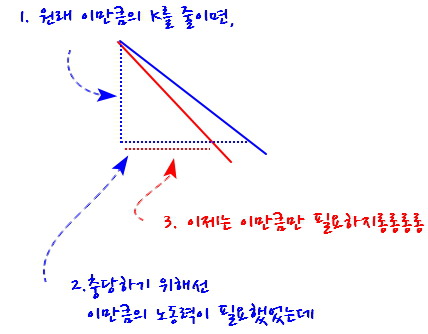
We can read it like this, right?
Which means stuff like workers’ manual skill, or the in-house education level at a firm — those drove the technological progress this time.
This kind is called “capital-saving technological progress.”
And of course there’s also the case in between.
For this one, we just go “right in the middle!”
“When the bump from workers leveling up and the bump from machinery/robots leveling up cancel out evenly” —
I guess that’s how you’d phrase it.

I drew the graph to compare, and~~
they came out the same~~
The ratio of K you need when you give up some L to make the same output,
or the ratio of L you need when you give up some K —
it stays the same. That’s what this is saying.
This was the last one —
“neutral technological progress.” That’s what it was about.
Originally written in Korean on my Naver blog (2016-07). Translated to English for gdpark.blog.
Comments
Discussion happens via GitHub Discussions. You'll need a GitHub account to comment.