Total Cost, Marginal Cost, and Average Cost
Wait, cost curves again?! Nope — this time we're plotting minimum TC against Q, then eyeballing derivatives to build the marginal and average cost curves from scratch.
Wait???? Cost curves???
Didn’t we already do this one????
You might be thinking that —
but what we did before was the isocost line, and this is the cost curve!!!!!!
The (total) isocost line is about the total cost determined by $(L, K)$.
The cost curve is about the (minimum) Total Cost determined by $Q$!!!!!!
So let’s start in the long run — the world where decisions are flexible (or, if you like, where there are no fixed costs). That perspective first.
OK so — how is the minimum long-run TC determined by $Q$?!!!!!
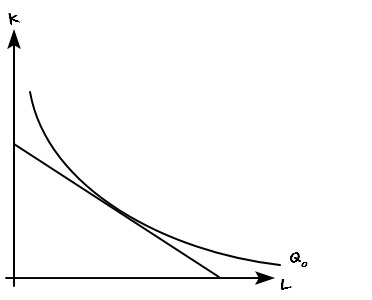
The isocost that’s tangent to the $Q_0$ isoquant — touching it at exactly one point like above — is the one that tells us.
And what does it tell us? It says the Total Cost is
$$TC_{0}$$So we’ll write down
$$\left( Q_{0},\quad TC_{0} \right)$$meaning “the minimum cost to produce quantity $Q_0$ is $TC_0$.”
Now let’s poke at a different production quantity
$$Q_{1}$$too.
And the minimum cost this time is
$$TC_{1}$$apparently…. Let’s jot that down too.
$$\left( Q_{1},\quad TC_{1} \right)$$like that…heh
We repeat this process infinitely many times and end up with infinitely many little notes@@@@@
Now where do we take all those infinite notes —
We bring ’em over here and plot all the infinite points@@@@@
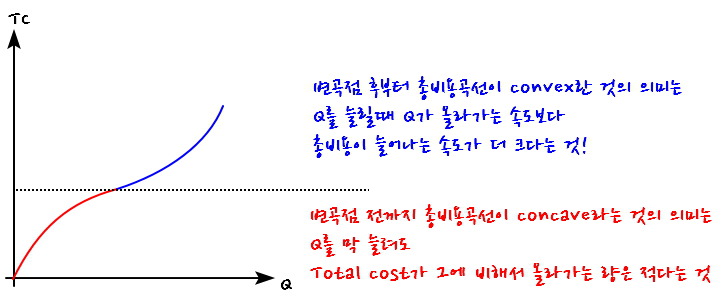
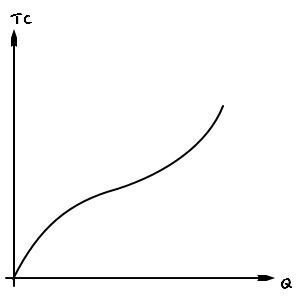
Plot every single one of those infinite points, draw a ’line’ through them, and supposedly it comes out looking like this!!!!!!!!!
Why on earth does it come out like that!!!!!!
Actually, this “total cost curve” is a mirror of the production function.

I don’t mean a mirror in the strict inverse-function sense — I mean the shape mirrors it.
The reason?!??!?!

Stare at the two for a sec — you can see they correspond to each other, right?!?!?
Let’s just accept that and roll with it.
OK so now let’s mess around with the $TC(Q)$ function a bit.
What does the ‘derivative (slope of the tangent line)’ mean for $TC(Q)$?
The derivative is
$$\frac {d}{dQ}TC\quad =\quad \frac {dTC}{dQ}$$and reading that out loud:
“When $Q$ changes by a tiiiny bit, $dQ$, how much~~~ does $TC$ change?”
In other words — that’s the marginal cost.
We’re going to draw the marginal cost curve.
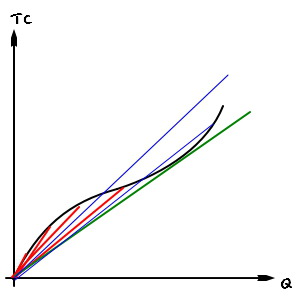
We don’t know how $TC(Q)$ depends on $Q$ algebraically, so we can’t just differentiate the formula — instead we’ll eyeball the derivative geometrically, straight off the original curve.
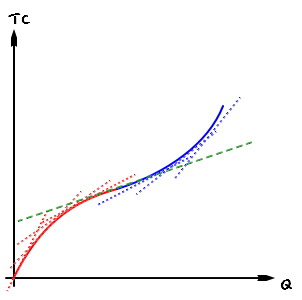
The slope is decreasing all the way up to that intersection of the red and blue points.
It bottoms out at the slope of the green dotted line —
and after that, it just keeps climbing!!!!!
Let’s transfer that onto the derivative graph.

On the y-axis I’ve abbreviated marginal cost as MC.
So the number on the y-axis is a number that represents a slope.
Now we get a graph that decreases~~~ all the way down to the y-value (remember: the y-value here is the slope) that the green point is talking about,
and then after that, the y-value (again — is the slope) goes whooshing back up.
OK, this time let’s pull out AC instead of MC.
AC stands for average cost, and AC is asking “on average, how much did one unit cost to make?”
In formula:
$$AC\quad =\quad \frac {TC}{Q}$$and so, geometrically,

on this graph, the slope from the origin is what gives you AC.
Now let’s think about how the slope-from-the-origin behaves as $Q$ changes!!!!!

Ohhhhh
The slope from the origin goes down until it hits the slope of that green line —
and after that, the slope goes back up!!!!!
So let’s slap that onto the $Q$–AC axes!!!!!
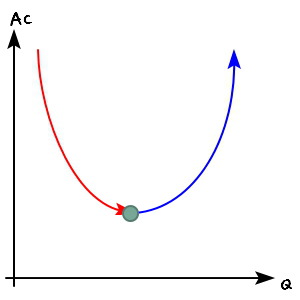
It looks like this!!!!!!!
One more thing!!!!!!!!!!!!!!
At that point where the slope hits the green slope —
“MC and AC have the same slope.”
In other words, at the $Q$ where the green point sits, MC = AC!!!!!!!!!
The reason I’m hammering on this is because
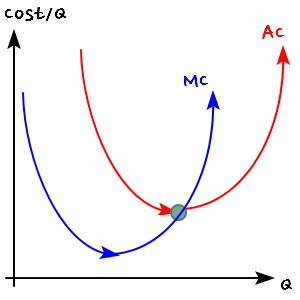
I’m about to plot MC and AC together on one set of axes!!!!
Now now now now now now now now —
we know that green point is the intersection of AC and MC,
but what about before and after………
Let’s check the $Q$ where the MC curve hits its extreme point, and the $Q$ where the AC curve hits its extreme point.
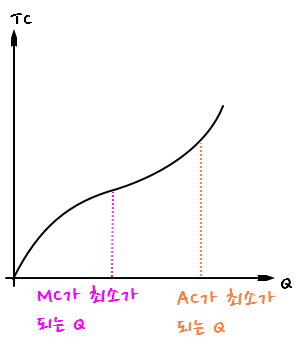
I’m not even gonna bother explaining — just look at the picture above and you’ve got it.
So: at the point where AC is minimized, $MC = AC$,
and on top of that, the $Q$ where MC is minimized is smaller.
Given these two facts, let’s plot them together on one set of axes.

With these two facts pinned down, on one set of axes,
only this shape is possible.
Summarizing what we’ve got:
MC passes through the extreme point of AC.
‘The MC value before it passes through AC’s extreme point is smaller than AC.’
“The MC value after it passes through AC’s extreme point is larger than AC.”
Yeah, I think that’s the summary.
OK so things have been going maybe a little too smoothly — just breeeeezing along graphically and geometrically.
As a last step, let me sketch a little scenario to make TC, MC, and AC feel like real things, and then we’ll wrap.
TC : the actual total cost
Boss: Hey hey hey hey hey hey, we’ve produced $Q$ of these now — how much money has actually gone into making the thing????
Employee: Yes yes yes yes yes yes, exactly $TC$ went in!!!
Boss: What the heck1?!?!?!?!?! Then how much did one unit cost to make?!?!?!?!
Employee: You can think of it as $AC$ per unit!!!!! (kind of a total-average vibe??? AC)
Boss: Oh is that so??!?!?!? Then how about we make just one more? If we made one more unit right now, how much extra cost would that take?????!!!
Employee: To make one more in the current situation, looks like $MC$ more should do it^^heh heh heh
Oh ho, is that so???~?!?
Sounds good~
So I’ll go ahead and make one more, or
I’ll stop making them right here.
And whether to make more or stop is decided by whether $AC > MC$ or $AC < MC$.
If the current AC is 3,000 won
and MC is 2,000 won,
isn’t it a no-brainer to throw in another 2,000 won and crank out one more of those AC-of-3,000-won units?!?!?!?
Flip it: if AC is currently 2,000 won and MC is 3,000 won —
if you were the boss, would you sink another 3,000 won
into making one more of something that’s only running you 2,000 won per unit on average??
Nobody’s doing that.
Alright, see you in the next post heh
Originally written in Korean on my Naver blog (2016-07). Translated to English for gdpark.blog.
Comments
Discussion happens via GitHub Discussions. You'll need a GitHub account to comment.