The IS Curve
Breaking down the IS curve — which maps the real interest rate to national income in goods-market equilibrium — because you'd better know this one well!
Now that Keynes has entered the scene, it looks like from here on out the analysis will be done with the aggregate demand–aggregate supply model.
But before getting into the full-blown aggregate demand – aggregate supply model, we learn about the IS curve.
They say the IS curve is, if anything, the first button in understanding aggregate demand?
From here on the explanation —
like, why business cycles occur, monetary policy during business cycles, etc. etc. etc. — will all be done with the IS curve, so…
Hmm… looks like I’d better know this well…
Since I’ll need to understand the stuff after this well too?!?!
The IS curve is said to be “something that represents the relationship between the real interest rate and national income when the goods market is in equilibrium”!!!
Alright then, the IS curve!!! Let’s dive in!!!!
Planned expenditure
‘Planned expenditure’ refers to the total amount that households, firms, the government, and foreigners intend to spend on goods and services produced “domestically,”
and this is different from ’ actual expenditure: the total amount they actually spent ‘!!
Planned expenditure is divided into 4 types!
Consumer expenditure (C): demand for goods and services.
Investment spending (I): firms’ spending on new physical capital and spending on new housing
Government spending (G): all forms of government spending
Net Export (NX): exports minus imports
Oh~~~ but Keynes thought that “aggregate demand” was equal to planned expenditure!
So,

he said this holds like-a so,
and now let’s rip it apart piece by piece!!
- Consumer expenditure C
When consumers decide how much to spend on goods and services?
Is it determined by income?
That’s no no, Keynes said it’s “disposable income.”
By this reasoning,

he said C is determined.
So, the shape of the ‘consumption function’ — the relationship that Keynes proposed between disposable income

and

— is
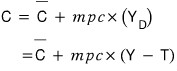
Here,

represents autonomous consumer expenditure.
This is said to be just an exogenous item unrelated to disposable income.
Mm~ it’s said to be determined by things like future income, consumers’ outlook on wealth,, that kind of stuff.

didn’t we learn this back in high school too~~~? It’s called the marginal propensity to consume,
a kind of “proportional constant” that shows how many units consumption increases each time “disposable income” increases by one unit.
- Investment spending
cf.) In economics, investment spending isn’t just buying stocks, bonds, and whatnot — it means purchasing newly produced real assets like (New) new machines, (New) new housing
Investment spending is divided into 2 types.
It’s divided into fixed investment and inventory investment,
where fixed investment is spending on firms’ equipment (machines, computers, etc.), facilities (factories, offices, etc.), or! planned spending on new housing,
and inventory investment refers to what is spent by firms to additionally hold raw materials, parts, or final goods.
(But they say inventory investment, while remarkably small in scale compared to fixed investment, plays a large role in determining national income, which is why it’s important..)
(Because inventory investment can always occur in unintended situations!
(Meaning sudden price fluctuations can always happen.) If unsold inventory is going to pile up,
to prevent that inventory pile-up, they’ll reduce “production.” Production.. national income… like this, inventory investment has a deep relationship with national income)
What else affects investment spending formed in this way?????
It’s the real interest rate.
Whether to invest vs. whether to buy a new machine
or whether to make a loan (bonds) — when making these decisions, firms will definitely decide based on the real interest rate.
Also, Keynes cited “firms’ future outlook” as one variable.
If optimistic, they’ll increase investment, if pessimistic, they’ll decrease it.
So he created autonomous investment (

).
This one is also lyke totally exogenous variable.
(Keynes said the thing that determines this is “animal spirits”.)
That way, the ‘investment function’ is represented like this.
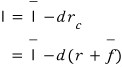

is (like coefficients such as mpc) a coefficient representing how sensitively or insensitively it reacts to the real cost of capital (

),
and the real cost of capital
is the real interest rate (

) plus financial frictions (

).
- Government spending
Government spending

is originally just an exogenous variable, so

and

is the same. Therefore

. (This is an assumption. An assumption.)
- Net export
Net export, like the above, is also divided into autonomous net export (

) and net export affected by the interest rate —
these two types.
The real interest rate and net exports were covered in the previous section.
If the U.S. real interest rate rises, other countries’ ningens will want to hold dollars more, so the value of the dollar rises and the prices of exported goods rise,
exports don’t do well, and thus net exports will decrease. (The opposite situation would all be the opposite!)
So the net export function goes lil like this
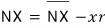
, and likewise here,

is also a coefficient that reacts to the real interest rate!
Keynes thought that when aggregate demand as planned total expenditure (

) coincides with total output (

), equilibrium in the economy is achieved.
Aggregate demand

Here, plugging in Keynes’s

,

Now rearranging for Y,

IS curve derived!
Finally seeing the IS curve!
As foreshadowed, the IS curve is the relationship between national income and the real interest rate r,
and what you have to be careful about (more like, what you need to know rather than be careful about) is that Keynes said

is

.
That is,
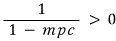
is positive.
Alright, now let’s look at

According to middle school math textbooks,

this is a linear function,
so since we’re drawing it on the r-Y plane here,

can be interpreted this way!~
Alright, now let’s try to get an intuitive understanding of the IS curve

the (-) terms

(financial frictions),

the smaller they get ~ the bigger the Y-intercept!!!!! i.e. Y gets bigger (huh, obviously lol)
And let’s also remember that a change in the Y-intercept means a shift of the curve itself!!
And let’s also remember that what determines the slope is

and

and

Also,
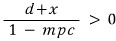
so the slope is negative!!
Therefore let’s also remember that the line is a downward-sloping line!
All the conclusions combined!!!!!!!!!!!!!
The IS curve, this downward-sloping line, is the combination of points that bring the goods market into equilibrium!!!!
Also, as always…. assuming other conditions are constant,
let’s set a situation where only one thing changes, and see how the graph changes according to that one thing!
● Change in the real interest rate:
This will cause a movement along the curve!!!
Why???????

it might be easier to think of it this way~
● Change in government spending <at a given real interest rate>

:
Since it changes the Y-intercept, it will cause a shift of the curve itself.
It’s said that during the Vietnam War, due to the U.S. increasing military spending, the curve shifted to the right.
(Usually during such times, it’s customary to raise the real interest rate too to prevent overheating of the economy, but exceptionally at that time, it’s said the FRB made the decision to freeze the real interest rate.)
● Change in taxes <at a given real interest rate>

:
An increase in taxes at a constant real interest rate will shift the curve downward (to the left)
● Change in autonomous consumption <at a given real interest rate>

:
Just consumption increasing is hard to say clearly via changes in C because the other variables are all tangled and twisted together..
This means you have to look at the change in autonomous consumption!! Autonomous consumption is an exogenous variable.
Then what causes a change in this variable?
A boom (as thought of), wealth, outlook on the future, etc.
● Change in autonomous investment <at a given real interest rate>

:
● Change in autonomous net exports <at a given real interest rate>

:
These are similar to the explanation above and can be understood in the same context.
● Change in financial friction <at a given real interest rate>
:
A change in financial friction moves the curve in the direction opposite to the change in financial friction.
Heads-up. The figures here are the original notes, slips and all. A few things to watch for:
- In the picture that expands Y = C + I + G + NX, the second line writes + d·f̄ where it should be − d·f̄ (the line above and the result after it carry the minus).
Comments
Discussion happens via GitHub Discussions. You'll need a GitHub account to comment.