The MP Curve and the AD Curve
We're diving into the MP curve — how central banks fiddle with nominal rates to steer real interest rates — then combining it with the IS curve to derive the AD curve!!
This time let’s study the “effect of monetary policy on aggregate demand.”
(The reason?? Because aggregate demand is clearly going to be affected by monetary policy too~??)
First, let’s look at the relationship between Inflation — which monetary authorities worry about the most — and the real interest rate through the MP curve (Monetary Policy).
The MP curve is the relationship between inflation and the real interest rate!!! hehe
Okay, and after we learn the MP curve~~~
We’ll combine it with the IS curve we studied earlier and derive the AD curve (Aggregate Demand)!!!!
Central banks around the world conduct policy by adjusting very short-term interest rates.
The FRB fiddles with the Federal fund rate,
and in our country, for the BOK, they mess with the base rate!!!
These interest rates are called nominal interest rates,
but!!!! actually, the interest rate that we looked at as important while learning Keynesian theory and that determines national income is the real interest rate.
The real one that really shows how much effect there actually is on the economy we live in — REAL!!!
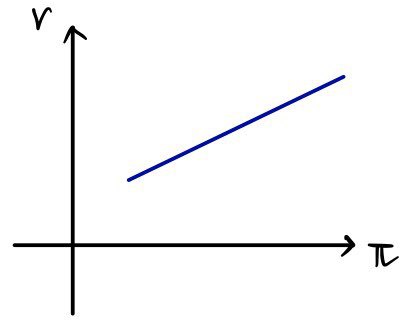
As we’ve learned many times, the real interest rate r is
the nominal interest rate minus the (expected) inflation rate!

Okay~~ now, by varying the nominal interest rate i as a monetary policy tool, we’re going to move the real interest rate to where we want it
— is that possible?
Hmm ~ because prices are sticky and move slowly,
they say that monetary policy doesn’t have an immediate effect on actual inflation or on expected inflation!!!!
(So that’s why they say they’ll look at it in the short run~)
Monetary Policy Curve (Monetary Policy Curve : MP curve)
Okay, how can the central bank, using the nominal interest rate they can fiddle with, actually control the real interest rate which is what they really want to control
We’ve seen the relationship between the nominal interest rate and the real interest rate, so now we’re going to look at the relationship between the real interest rate (which is adjusted through the nominal interest rate) and the inflation rate!
If we draw this relationship between the real interest rate and the inflation rate on a graph with π and i axes, that is exactly the MP curve!
Riiight here!
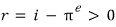
To tell you the conclusion first — when you draw the MP curve, you get an upward-sloping graph!
Now, how should we understand the fact that it slopes upward!
Economists observed central banks from a third-party perspective
and found that they make it slope upward on these axes!!! (That’s how I understood it… ha)
Ah, then why! does the central bank decide the real interest rate by fiddling with the nominal interest rate in a way that makes it slope upward on those axes!!
The reason is that the central bank makes its decisions while following the “Taylor Principle”!!!!
What’s the Taylor Principle!?
The “Taylor Principle” is: “when expected inflation rises, the monetary authority must raise the nominal interest rate by more than the expected inflation”!!!!!
Like this!?
The reason that high inflation brings about a high real interest rate~~~ is simple!
“Because when inflation rises, if the real interest rate is low, you’re screwed”

↑ when this happens,

if you just leave this alone,

this ↓ goes down,
then

this ↓ goes down and national income

goes ↑ up, then again

↑
like this, inflation rises and it keeps cycling, cycling, vicious cycle…. you’re screwed….!!!!
So that’s why it’s drawn like this~~~
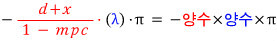
And that relationship is

this equation, hehheh
And… as always…………
Let’s look at the shifts of the MP curve
Okay~~~ we now know that the MP curve is drawn as upward-sloping!~~~ oho
So now let’s find out when the shifts of the curve happen~~~~ something like that
(I said “let’s find out” all grandly, but actually there’s nothing much to it..T_T T_T)
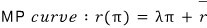
The MP curve, as I said before,

is determined by this equation,
that is, the slope of the graph is λ, and the r-axis intercept is

this.
As for the factors that shift the MP curve, as you can tell just from looking at the equation,

it’s only when this moves!! that’s the only time?!!!!
The monetary authority, by changing this

independent component contained in the real interest rate, controls the MP curve!!!!
<The central bank’s action of raising the real interest rate in response to a rise in the inflation rate according to the Taylor Principle : is a movement along the curve!!>
Hmm~~ at a given inflation rate π, since they want to bring the inflation rate down below π,

they may raise this

Raising this : when keeping the real interest rate high
monetary policy is said to be ‘contractionary’, and this kind of policy is called an “autonomous tightening of monetary policy”

Lowering this : when keeping the real interest rate low
monetary policy is said to be expansionary, and that kind of policy is called an “autonomous easing of monetary policy.”
cf.) An autonomous monetary tightening causes an economic contraction and a fall in inflation~
The opposite is the opposite~~
AD curve (aggregate demand curve)
Okay, now finally!!!!! the synthesis!!!!! lolol
First~~~ looking back again~~~ the IS curve was the relationship between Y and r~
and the MP curve was the relationship between r and π~~~

Thinking of it as a composite function, I’ll combine the two~~~~~~
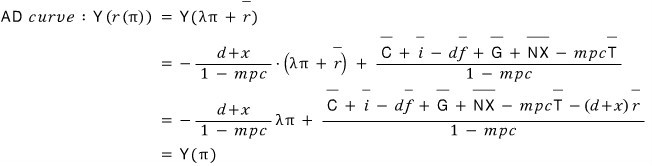

the slope is negative!!!!!!!!!!!!!!
Okay!!!! so the Y(π) graph is downward-sloping~~~~~~~~~~
Okay~~ and also~~ as always, let’s look at the terms that cause the AD curve to shift!!
If we split the terms at the back that cause the graph to shift into the red part and the blue part!!!~~~

Now everyone gets the feel, right~~~
The red part is the part that caused the IS curve’s own shifts~~~~!!! In the AD curve, the sign stays the same!
That is, the AD curve shifts in the same direction as the IS curve’s shifts.
The blue part is the part that caused the MP curve’s own shifts!!! In the AD curve, the sign is reversed!!
That is, the AD curve shifts in the opposite direction to the MP curve.
<cf. When we looked at the MP curve, the π axis was the x-axis, but in the AD curve it becomes the y-axis. You must not get confused about whether it’s a parallel shift in the x-axis direction or in the y-axis direction!>
I’ll see you in the next post for the aggregate supply part!!~~!!
Originally written in Korean on my Naver blog (2015-07). Translated to English for gdpark.blog.