The AS Curve (Aggregate Supply Curve)
A casual, student-eye-view breakdown of the AS curve — why output and inflation move together and what short-run vs. long-run aggregate supply actually means.
Has everyone studied macroeconomics? I’ve got macroeconomics lined up for next semester, and…
Just, T in my freshman year of college I took ‘Introduction to Economics’
and then in the military I studied the high school senior CSAT economics subject up to about a grade-1 level,
and after returning to school I took Principles of Economics 1 and Principles of Economics 2~~~
and then now
“holy crap, this economics stuff is totally my style for real lol lol lol lol”
going like that, I’m currently doing it as a double major…..ugh… it’s hard………..haha
Deriving equations crisply like in physics is actually surprisingly more difficult….haha why is it….T_T
Anyway!!! The aggregate supply curve!!!
First, aggregate supply is classified into “short-run aggregate supply” and “long-run aggregate supply.”
The reason is that output (Y), when viewed in the long run, does not depend on anything like prices,
but rather on things like science and technology, politics, social infrastructure, etc.,
but when viewed in the short run, they say it depends on prices….hehehe
Oh, and the total output Y in the long-run aggregate supply curve is
the output produced at the “natural rate of unemployment” level (about 5%),
that is, the “natural output (or potential output,

).
Hmm~ the long-run aggregate supply curve is somewhat acceptable!!
But….. what is this short-run aggregate supply curve…..
Here, it becomes the claim that output Y is affected by the inflation rate….haha
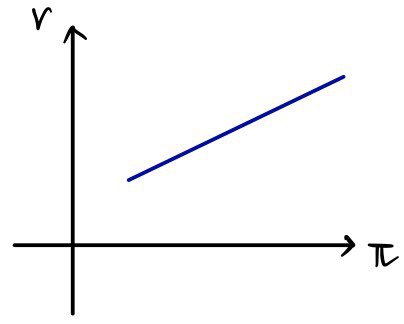
And to speak from the conclusion again, the inflation rate and output
within the graph, slope upward to the right!!!!!~~~
I’ll blab out the reason they slope upward to the right
We’re cranking out output Y like crazy~~~ and it feels like we might be able to squeeze out a bit more, right???
So squeeze more out! Then workers will demand higher wages, and firms will think an opportunity has arisen to raise prices!!!
This way the inflation rate will rise,
And looking at the opposite situation, cranking out Y feels….kind of… burdensome. So if we reduce output, workers also accept and take in lower wages,
And at that point if the firm sticks to the original price?????will the products sell well????
No no no no, at that point now they’ll lower the product’s price in order to sell…
The inflation rate will go down!!!!! Okay~~!!~
So now we know that Y and π move in the same direction~
And therefore a graph that slopes upward to the right is drawn.
Actually, above I said “it feels like we could squeeze out a bit more” and “it feels a bit burdensome,”
but actually, economists say that’s caused by the gap between Potential Output and actual Y.
Catching that gap (somewhat intuitively), and how much you reduce it or how much you increase it, will differ by country (due to cultural differences?)
Yep yep all those sensitivities differ, right?? Let’s call that sensitivity γ (gamma).
That is,

and

move in the same direction.
(

is called the output gap)
And and and there’s also something else that determines the inflation rate!
Expected inflation rate

this one, and
price shocks (price shocks arising from supply shocks)
these things!
So putting it all together
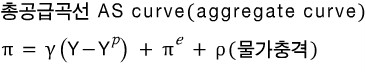
Hmm okay so the aggregate supply curve (the relationship between π and Y) follows that equation~~~~~~~ we’ve come to know.
Aha, so then
we can once again really dig into the meaning of γ.
Looking at gamma again, you can see it as the “slope” between π and Y!
So not that the slope is infinity,
but let’s look at a situation where it’s ver~~~~~y close to infinity and figure out the meaning of that gamma~
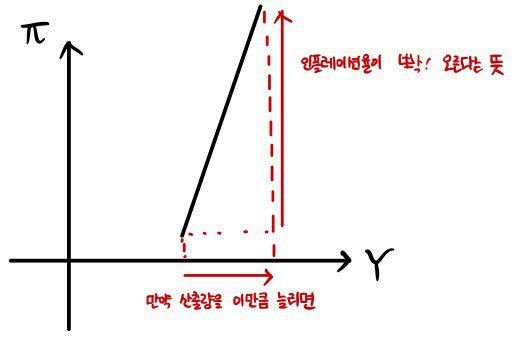
This, they say, means there is a ’time lag’ between wages and prices.
When gamma becomes infinity and the graph becomes a vertical line, it means the rigidity of wages and prices breaks down.
Once more,, the fact that the inflation rate responds greatly to this~much output means that wages and prices respond that flexibly!
It not being infinity~ means wage-price rigidity exists!
Ahuh~well then~~ if Y changes??? there will be movement along the curve.
Since it’s the independent variable…
But…
**

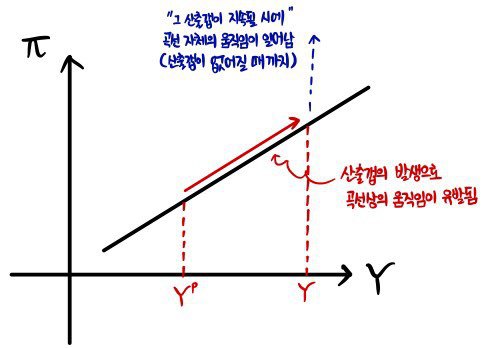
if this ‘persists’, they say the AS curve moves as a whole,
what does that mean……haha
First, movement along the curve is correct,
but as emphasized, if that output gap “persists,” the story changes and movement of the AS curve itself is induced.
Alright, first let me blab it out,

if that occurs bam!!!, movement along the curve happens. So π grows!
However, if it “keeps staying there”
☞
“the expected inflation rate grows..”
☞
so the AS curve moves upward.
Until when???????

=0, until it becomes that!!!
Originally written in Korean on my Naver blog (2015-07). Translated to English for gdpark.blog.