Derivation of the Poisson Distribution
Derive the Poisson probability formula from the binomial distribution, follow a handwritten one-page derivation, and plot probabilities with Python.
Then let us head into distributions now!!!!!
I am actually in the physics department, and the field I want to specialize in is statistical physics, so I had worked kind of hard on statistical physics
and there ....... well, you start with the Gaussian
and go all the way~~~ to things like the Fermi–Dirac distribution and Bose–Einstein distribution, so I thought I knew distributions a little.......
but when I encountered some distribution in statistics.......... that I had never even heard of or seen.........
I was pretty taken aback....... So.......
Originally, in the basic post I was going to look only at the Γ-distribution, \(\chi^2\)-distribution, t-distribution, and F-distribution, which I had not known,
but I think it would be better to build up step by step from other basic distributions
First is the Poisson distribution (Poisson Distribution)!!!!
Actually, I have covered the Poisson distribution once before.
This is really really really really really really really really really really really really really really really suitable as a distribution for events that do not happen very often
and they say it is a distribution used for things like deaths occurring in the military or the number of traffic accidents in a particular region.
Originally, they say this Poisson distribution was developed to find an approximation to the binomial distribution.
For example, the probability that one person dies in a year from a certain blood type is 0.00001,
and if we think about the probability that five or more of 200,000 people die from this blood disease in a year
n=200000
trying to find it with a binomial distribution with p=0.00001 makes the calculation filthy, is what I mean
So, fixing np=λ like this in the binomial distribution B(n,p),
if we look at the approximation to the binomial distribution when we make n sufficiently large
the probability density function of the binomial distribution
\[f(x)=\frac{n!}{x!(n-x)!}p^x(1-p)^{n-x}\]
(The modeling principle behind this probability density function is natural if you know the counting-possibilities material from high school,
so I will skip the modeling and go straight ahead.)
\[\begin{aligned}f(x)&=\frac{n!}{x!(n-x)!}p^x(1-p)^{n-x}\\&=\frac{n!}{x!(n-x)!}\left(\frac{\lambda}{n}\right)^x\left(1-\frac{\lambda}{n}\right)^{n-x}\\&=\frac{n!}{x!(n-x)!}\left(\frac{\lambda}{n}\right)^x\frac{\left(1-\frac{\lambda}{n}\right)^n}{\left(1-\frac{\lambda}{n}\right)^x}\end{aligned}\qquad\text{Taking }\lim_{n\to\infty}\text{ here,}\]
I will start by picking at this first!!!!
\[\lim_{n\to\infty}f(x)=\lim_{n\to\infty}\frac{\textcolor{red}{n!}}{x!\textcolor{#00bf00}{(n-x)!}}\left(\frac{\lambda}{\colorbox{blue}{$\textcolor{white}{n}$}}\right)^x\frac{\left(1-\frac{\lambda}{n}\right)^n}{\left(1-\frac{\lambda}{n}\right)^x}\]
Red is n(n-1)(n-2) ~~~~~
Green is (n-x)(n-x-1)(n-x-2) ~~~~
Blue is n to the power of x
But with n going to a limit, do the -1 and -2 in n(n-1)(n-2) ~~~ matter?
It is like taking a cup of water from the Han River and then calling the Han River management office to say, “The Han River’s water is drying up and disappearing right now!!!” right??
Then what is the order of the red part???? I am asking what power of n the red term would be.
Yep. If I play a little trick on the expression to make it easy to count, (n-0)(n-1)(n-2)~~~~(n-(n-1))
there are n-1 of them from 1 to n-1, so including 0 there are n of them
That is, n to the power of n.
(How to count. http://gdpresent.blog.me/221113380202)
What would the order of (n-x)(n-x-1)(n-x-2) ~~~~ be???? We need to count the number of terms here too.
It would go up to (n-x)(n-x-1)(n-x-1) ~~~~(n-x-(n-x-1)),
so let us count carefully.
(n-x-(0)))(n-x-(1))(n-x-(2)) ~~~~(n-x-(n-x-1))
If we play this trick and find the count,
there are n-x-1 of them from 1 to n-x-1
and if we count 0 too, there are n-x of them.
That is, n to the power of n-x.
Then, to tidy things up a little
\[\lim_{n\to\infty}f(x)=\lim_{n\to\infty}\frac{\textcolor{red}{n}^{n}}{x!\left(\textcolor{#00bf00}{n}^{n-x}\right)}\frac{\lambda^x}{\colorbox{blue}{$\textcolor{white}{n^x}$}}\frac{\left(1-\frac{\lambda}{n}\right)^n}{\left(1-\frac{\lambda}{n}\right)^x}\]
If we just think about the colored parts, they all put their heads down together and flip over
\[\frac{\textcolor{red}{n}^{n}}{\left(\textcolor{#00bf00}{n}^{n-x}\right)}\frac{1}{\colorbox{blue}{$\textcolor{white}{n^x}$}}=n^n\cdot n^{-(n-x)}\cdot n^{-x}=n^{n-n+x-x}=n^0=1\]
Okay ~ one thing is settled.
If we look at the other terms involving n heading to infinity,
\[\begin{aligned}\lim_{n\to\infty}\left(1-\frac{\lambda}{n}\right)^n&=e^{-\lambda}\\\lim_{n\to\infty}\left(1-\frac{\lambda}{n}\right)^x&=1\end{aligned}\]
it becomes like this.
The natural constant.... that thing..... .....
I do not need to do it, right??????
No. I will just do it once
It is simple, so, well
\[\begin{gathered}\text{Definition of the natural constant:}\\\lim_{n\to\infty}\left(1+\frac1n\right)^n=e\quad\text{This expression can be changed to a limit approaching 0}\\t=\frac1n\text{; substituting this, }n\to\infty\text{, so }t\to0\\\text{That is, }\lim_{n\to\infty}\left(1+\frac1n\right)^n=\lim_{t\to0}(1-t)^{1/t}=e\end{gathered}\]
Well, anyway, that is the definition
\[\begin{gathered}\text{Definition: }\lim_{n\to\infty}\left(1+\frac1n\right)^n=\lim_{t\to0}(1-t)^{1/t}=e\quad\text{Keeping the definition in mind,}\\\text{let us play with }\lim_{n\to\infty}\left(1-\frac{\lambda}{n}\right)^n\text{; I will go one step further.}\\\begin{aligned}\lim_{n\to\infty}\left(1-\frac{\lambda}{n}\right)^n&=\lim_{n\to\infty}\left(1+\left(-\frac{\lambda}{n}\right)\right)^n=\lim_{n\to\infty}\left(1+\left(-\frac{\lambda}{n}\right)\right)^{n\cdot\frac{\lambda}{\lambda}}\\&=\lim_{n\to\infty}\left(1+\left(-\frac{\lambda}{n}\right)\right)^{-n\cdot\left(-\frac{\lambda}{\lambda}\right)}=\lim_{n\to\infty}\left(1+\textcolor{red}{\left(-\frac{\lambda}{n}\right)}\right)^{\textcolor{blue}{\left(-\frac n\lambda\right)}\cdot(-\lambda)}\\&=\lim_{n\to\infty}\textcolor{#00bf00}{\left(1+\left(-\frac{\lambda}{n}\right)\right)}^{\textcolor{#00bf00}{\left(-\frac n\lambda\right)}\cdot(-\lambda)}\\&=e^{-\lambda}\end{aligned}\\\text{I have made the red and blue reciprocal!}\\\text{The green will converge to }e\text{!}\end{gathered}\]
so
\[\begin{aligned}\lim_{n\to\infty}f(x)&=\lim_{n\to\infty}\frac{n^n}{x!\left(n^{n-x}\right)}\frac{\lambda^x}{n^x}\frac{\left(1-\frac{\lambda}{n}\right)^n}{\left(1-\frac{\lambda}{n}\right)^x}\\&=\frac{\lambda^x e^{-\lambda}}{x!}\end{aligned}\]
the derivation is finished!!!!
Why did I derive it, you ask?????
The fact that we could know where the Poisson distribution came from and how
was something we could learn through the derivation!!!!!
Since the probability distribution function looks like that,
if we were told to write the cumulative probability distribution as an expression,
\[\mathrm{P}(X\le x)=\sum_{k=0}^{x}\frac{\lambda^k e^{-\lambda}}{k!}\]
Of course, if it were continuous, we would express it with an integral, right?
The worked problems for the Poisson distribution
are here!!!! ( http://gdpresent.blog.me/220582073367)
You only need to look at Prob 3.3! >_<
what would that even mean?
The probability that the event occurs x times
| |
cs |
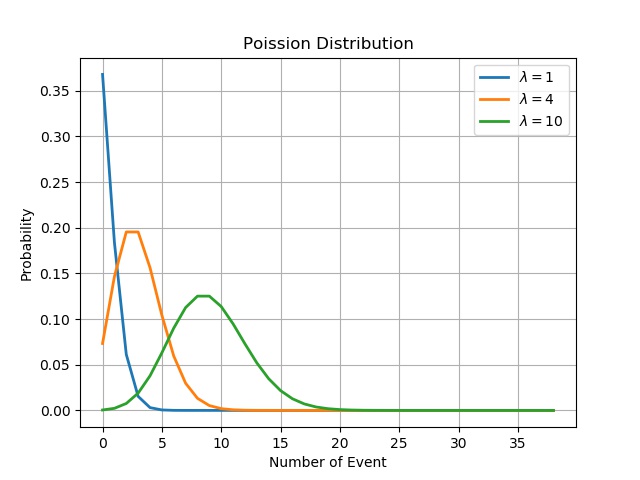
Scientific clarifications to the historical learning note.
The historical prose, formulas, code, and original plot above are retained.
Discrete probabilities and rare events
The binomial and Poisson distributions assign probabilities to integer counts, so their formulas are probability mass functions, rather than continuous probability densities. A Poisson model is not justified by rarity alone. The binomial approximation here assumes independent trials with a common success probability. For a homogeneous Poisson process, independent increments and a constant rate are additional modeling assumptions; the Poisson distribution itself can have a large mean.
The valid binomial-to-Poisson limit
For each fixed nonnegative integer $x$ and fixed $\lambda>0$, take integer $n\to\infty$ with $p=\lambda/n$. The correct factorial factor is $\frac{n!}{(n-x)!n^x}=\prod_{j=0}^{x-1}(1-j/n)\to1$; the empty product for $x=0$ equals one. Together with $(1-\lambda/n)^n\to e^{-\lambda}$ and $(1-\lambda/n)^x\to1$, this gives $\mathrm{P}(X=x)\to e^{-\lambda}\lambda^x/x!$. Replacing the individual factorials by $n^n$ and $n^{n-x}$ is not a valid asymptotic equivalence; counting their factors does not establish those replacements.
The sign in the exponential limit
The historical typed derivations use $(1-t)^{1/t}$ while calling its limit $e$. In fact, $\lim_{t\to0}(1+t)^{1/t}=e$, whereas $\lim_{t\to0}(1-t)^{1/t}=e^{-1}$, with positive bases near zero. Substituting $t=1/n$ into $1+1/n$ gives $1+t$. In the later Poisson calculation, $t=-\lambda/n$ approaches zero from below, and $(1+t)^{(1/t)(-\lambda)}\to e^{-\lambda}$. The handwritten green identity uses the correct plus sign. Manipulations dividing by $\lambda$ assume $\lambda>0$.
Support, parameters, and the cumulative distribution
The Poisson mass function is $\mathrm{P}(X=k)=e^{-\lambda}\lambda^k/k!$ for integers $k\ge0$ and $\lambda\ge0$. At $\lambda=0$, the distribution puts probability one at zero. For real $x\ge0$, its cumulative distribution is $F(x)=\sum_{k=0}^{\lfloor x\rfloor}e^{-\lambda}\lambda^k/k!$; for $x<0$, $F(x)=0$. The historical upper bound $x$ is literal and is appropriate when $x$ is a nonnegative integer.
Two slips in the expanded product
The historical prose repeats $(n-x-1)$ where the next factor would normally be $(n-x-2)$, and the later expanded product begins $(n-x-(0)))$ with an extra closing parenthesis. These are transcription slips, retained above; the fixed-$x$ factorial ratio in the preceding clarification supplies the precise argument.
The numerical rare-event example
The example switches between “blood type” and “blood disease,” so the wording does not consistently identify its hypothetical event. Under the stated independent-trial model, $n=200000$ and $p=0.00001$ give $\lambda=np=2$. The Poisson approximation to the probability of at least five occurrences is $1-e^{-2}\sum_{k=0}^{4}2^k/k!\approx0.05265$, or about $5.265\%$. This calculation uses the hypothetical probabilities in the note and adds no medical interpretation.
What the historical Python plot shows
The loops use range(1, 40), so they calculate masses for counts 1 through 39 and omit count zero. With only a list of vertical values, plt.plot(pdp) assigns horizontal coordinates 0 through 38; the plotted coordinate is therefore one less than the event count. To plot the actual count, include zero and pass the count values explicitly. The connecting lines join discrete probabilities and do not turn them into a continuous density. The historical code, plot, and title spelling “Poission” are retained.
Normalization and the meaning of lambda
The probabilities sum to one because $e^{-\lambda}\sum_{k=0}^{\infty}\lambda^k/k!=1$. The resulting count has mean and variance $\lambda$, so $\lambda$ is the expected number of occurrences in the specified interval. These properties describe the derived distribution; they do not validate the historical replacement of individual factorials.
Comments
Discussion happens via GitHub Discussions. You'll need a GitHub account to comment.