Derivation of the Gamma DistributionPhysicsBasic Statistics I Studied4Deriving the Gamma distribution from scratch by connecting it to the Poisson process — turns out it's just waiting for the α-th event instead of the first!!!!
Deriving the Gamma distribution from scratch by connecting it to the Poisson process — turns out it's just waiting for the α-th event instead of the first!!!!
·13 min read·gdpark
Now it is time to move on to the gamma distribution,
and the Γ distribution is actually related to the exponential distribution!!!!
Why? Remember that the exponential distribution described the waiting time until the first Poisson event occurs in a Poisson process with mean λ
—that was what the exponential distribution was about, right???????????
Poisson process:
Events occur randomly over time, and
1. The numbers of events occurring in nonoverlapping intervals are mutually independent;
2. The probability of one event occurring in a short interval is proportional to the length of that interval;
3. The probability of two or more events occurring in a short interval can be neglected;
4. If these conditions hold identically in every part of the time span,
we call it a Poisson process.
The gamma distribution
is the distribution representing the waiting time until α Poisson events have occurred!!!!
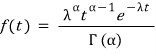
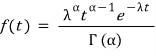
Let me throw out the definition first:
That is the formula....
Let us derive it briefly!!!!
We will follow the same approach as in our derivation of the exponential distribution!!
Let us think about the cumulative probability distribution.
The Poisson distribution
was this.
Poisson distribution =
\[\frac{\lambda^xe^{-\lambda}}{x!}\]
This is a “Poisson distribution with an average of λ events per unit time,”
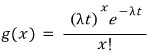
so a “Poisson distribution with an average of λt events over time t”
looks like this.
In this distribution, the probabilities of 0 events, 1 event, ~~~~~~~~~, α−1 events, and α events
will be g(0), g(1), ~~~~~~~~~~, g(α−1), and g(α).
<Wait!!!!!!!!!!!!!!!!!!!!!!!!!!!!!!!!!!!>
Let us pause to point something out here.
In the gamma distribution, then, the things that seem meaningful are:
λ matters,
and α matters too!!!!
It matters which Poisson distribution we started with—how many events, on average, it represents over time t—
and it also matters how many events we are waiting for, does it not?!?!!?
I will reveal what these guys are at the very end.
Now, to change this into “the time until the α-th occurrence,”
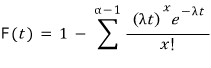
I will add all the probabilities up to the α−1-th event (using the same idea as in the exponential-distribution derivation).
\[P(\text{fewer than }\alpha\text{ events occur})=g(0)+g(1)+\cdots+g(\alpha-1)\]
This means
\[P(\text{at least }\alpha\text{ events occur})=1-P(\text{fewer than }\alpha\text{ events occur})\]
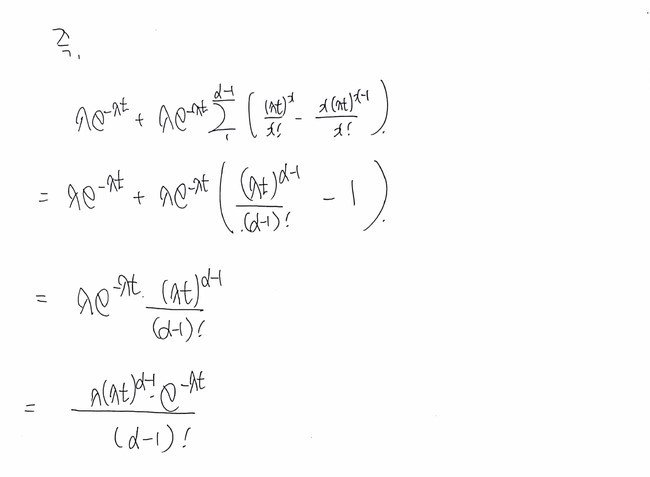
The complete visible bottom-right RHS, including its equals sign, fraction, denominator parentheses and factorial, and minus one, is transcribed below. The left-side sum and edge connecting strokes remain clipped and unknown; no complete bottom equation is reconstructed.
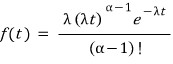
\[=\frac{(\lambda t)^{\alpha-1}}{(\alpha-1)!}-1\]
Source limitation: The original clips strokes at its right and bottom edges; only the visible text is transcribed.
That is how far we got!!
Writing that factorial in the denominator this way makes the expression defined only when (α−1) is zero or a natural number,
so let us use the gamma function to write it more generally!!!
(The derivation of the formula is here: http://gdpresent.blog.me/220581881465 !!!!)
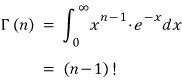
Here I will just throw out the definition of the gamma function!
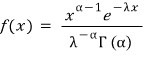
That is it. So now we can express the formula above using the gamma function!
Let us calculate μ and σ² again with the moment generating function.
When we first wrote the probability distribution, we used t (time) as its variable. But in the MGF, t is already the MGF variable! So let us change the t we have used so far into x!
Finally, let us organize the “additivity” property before moving on!
If a random variable follows the displayed formula, we say “the random variable x follows a gamma distribution with parameters (α, λ),” remember????
And we checked that it reduces to the exponential distribution when α=1.
Now suppose we have α random variables X₁, X₂, ..... , Xα,
each mutually independent and following an exponential distribution with parameter λ!!!
(You can already get a feel for what I am going to say, right??? If you have a gamma feeling, it is the gamma distribution....!!! Sorry!!!!!!!!!!!!!!!!)
You have not forgotten, right??????
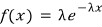
The exponential distribution with parameter λ is the displayed formula!
Oh, whatever... you have all got the idea already.....
Let me give the conclusion first,,,,
Additivity means that the random variable Y defined this way follows a gamma distribution with parameters (α, λ).
I will prove it!
It is very simple for something called a proof, but I thought it would be good to know the principle!!!
If we bring out the moment generating function of the random variable Y and keep going,
Therefore, for mutually independent Xi, each following a gamma distribution with (ri, λ), Y=X₁+X₂+···+Xk follows a gamma distribution with (r₁+r₂+···+rk, λ).
Correction to this original green claim: for c>0, cX has shape r and rate λ/c, so cX∼Gamma(r,λ/c). Gamma(cr,λ) instead describes a sum of c independent copies for positive integer c. This shared correction applies to both img_117 and img_123.
Source limitation: The historical scaling assertion is reproduced here; see the adjacent correction.
Therefore, for mutually independent Xi, each following a gamma distribution with (ri, λ), Y=X₁+X₂+···+Xk follows a gamma distribution with (r₁+r₂+···+rk, λ).
Correction to this original green claim: for c>0, cX has shape r and rate λ/c, so cX∼Gamma(r,λ/c). Gamma(cr,λ) instead describes a sum of c independent copies for positive integer c. This shared correction applies to both img_117 and img_123.
Source limitation: The historical scaling assertion is reproduced here; see the adjacent correction.
1
2
3
4
5
6
7
8
9
10
11
12
13
14
15
16
17
18
19
20
21
22
23
24
25
26
27
28
29
30
31
32
33
34
35
36
37
38
39
40
41
42
43
44
45
46
47
48
49
50
51
52
53
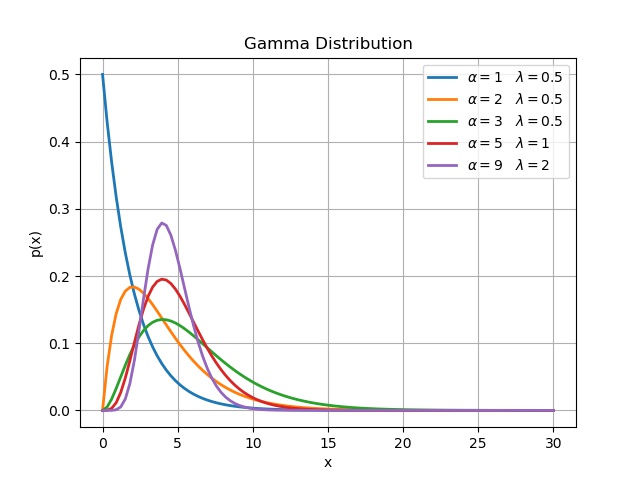
import numpy as np
import matplotlib.pyplot as plt
import os
import scipy.stats as sc
pdp = []
alpha =1.0
llambda =0.5
scale=1./llambda
x = np.linspace(0, 30, 100)
y = sc.gamma.pdf(x, a=alpha, scale=scale)
plt.plot(x, y, linewidth=2.0, label = r'$\alpha =$1 $\lambda =$0.5')
pdp = []
alpha =2.0
llambda =0.5
scale =1./llambda
x = np.linspace(0, 30, 100)
y = sc.gamma.pdf(x, a=alpha, scale=scale)
plt.plot(x, y, linewidth=2.0, label=r'$\alpha =$2 $\lambda =$0.5')
pdp = []
alpha =3.0
llambda =0.5
loc = alpha / llambda
scale =1./llambda
x = np.linspace(0, 30, 100)
y = sc.gamma.pdf(x, a=alpha, scale=scale)
plt.plot(x, y, linewidth=2.0, label=r'$\alpha =$3 $\lambda =$0.5')
pdp = []
alpha =5.0
llambda =1.0
scale =1./llambda
x = np.linspace(0, 30, 100)
y = sc.gamma.pdf(x, a=alpha, scale=scale)
plt.plot(x, y, linewidth=2.0, label=r'$\alpha =$5 $\lambda =$1')
pdp = []
alpha =9.0
llambda =2.0
scale =1./llambda
x = np.linspace(0, 30, 100)
y = sc.gamma.pdf(x, a=alpha, scale=scale)
plt.plot(x, y, linewidth=2.0, label=r'$\alpha =$9 $\lambda =$2')
Scientific clarifications, separate from the historical source
The 2017 author’s statements above are translated literally, including historical errors.
λ is the positive arrival rate per unit time, and E[N(t)]=λt. Waiting for the α-th event and summing α exponential variables requires an integer α≥1. The Gamma density extends to every real α>0; this does not mean a fractional event count.
The finite sum for fewer than α events is survival P(T>t); its complement is the CDF P(T≤t). The historical exact-time probability statements in P111/P113/P114 and img_121 should be read as density descriptions: for a continuous T, P(T=t)=0. Interval probabilities are obtained by integrating f. The historical symbol P(t) in img_121 and img_122 labels a density here; it is not the probability of an exact waiting time.
Γ(a) is defined by its integral for real a>0; Γ(n)=(n−1)! is the positive-integer specialization. In the source convention α is shape, λ is rate and θ=1/λ is scale. The Gamma function in P130 is distinct from the Gamma probability distribution. P117 literally says “alpha and gamma”; surrounding formulas use alpha and lambda. In P128, μ is the Gaussian mean, σ the standard deviation, and σ² the variance.
The MGF is finite for its argument t<λ and diverges at t≥λ. The historical sheets rename the density variable to x while using t for the MGF argument. The mean and variance are α/λ and α/λ². Independent Gamma variables add their shapes when they share rate λ.
The source code uses a=alpha and scale=1/llambda with the default location zero. Its loc=alpha/llambda assignment is not passed to gamma.pdf. The five plotted (α,λ) pairs are (1,.5),(2,.5),(3,.5),(5,1),(9,2). Unused imports and assignments are preserved.
The clipped historical img_054 right/bottom strokes and img_120 margin-note endings remain unknown. The legible continuation and cleaner derivative sheet are independent source evidence; they do not recover missing handwriting.


Comments
Discussion happens via GitHub Discussions. You'll need a GitHub account to comment.