Critical Temperature, Volume, and Pressure of the Van der Waals Gas
We figure out exactly when a van der Waals gas stops acting like an ideal gas and hunt down the critical temperature where that wild dented p-V curve first appears!
(source: http://www.fisicamente.net/A/index-1784.htm)
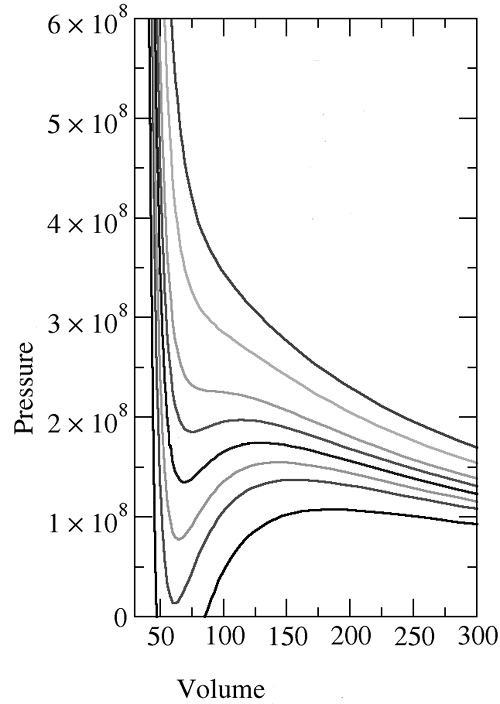
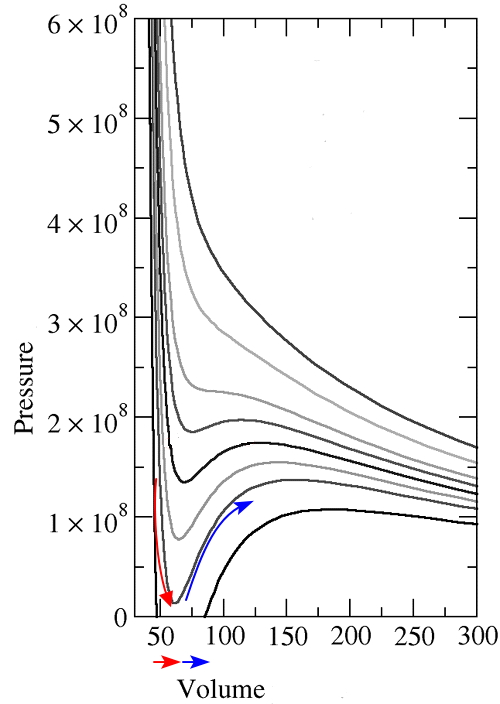
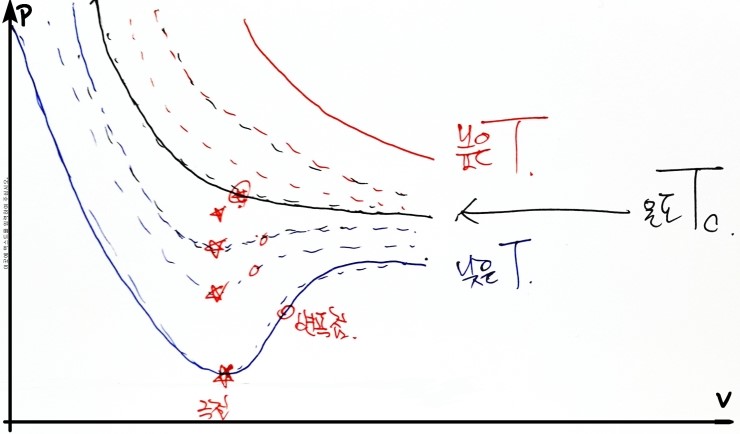
As you all probably know, for a van der Waals gas, the p-V graph is drawn like this for increasing temperatures.
Wait, but!!!?!??
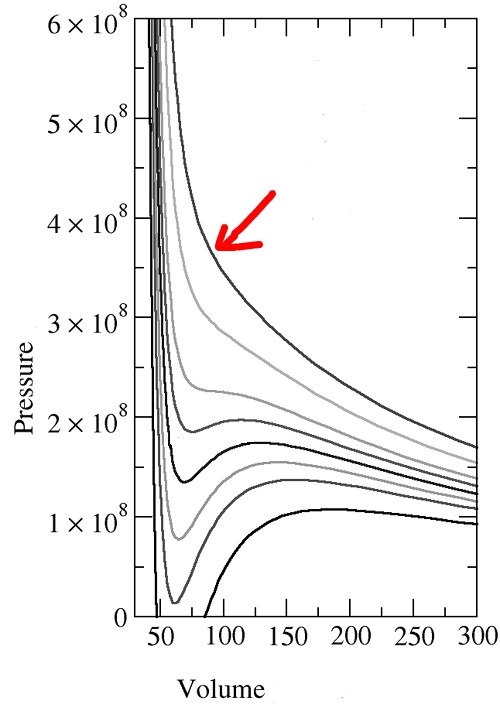
Among them, please look at the p-V line at the highest temperature!!!
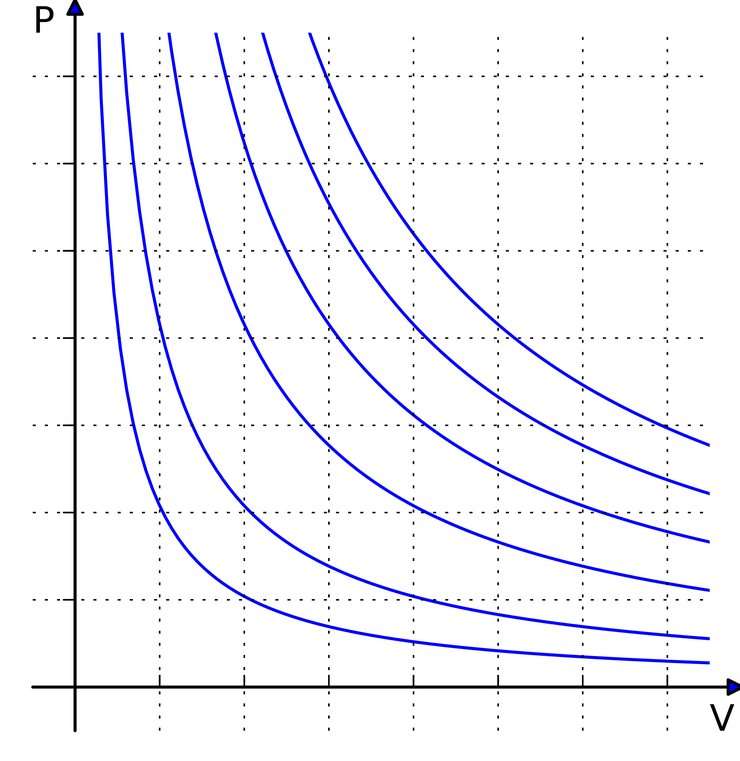
This!!?!?!? Isn’t it exactly the same as the p-V graph of an ideal gas?!?!?!?!
Behaving like an ideal gas means
(source: https://en.wikipedia.org/wiki/Ideal_gas_law )
that a graph inversely proportional between p and V is drawn,
which means that the larger the pressure gets, that is, the more pressure you apply, the smaller the volume of the gas gets
That is,
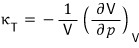
the “isothermal compressibility,” which is the percentage rate of change of V with respect to pressure change, is always positive.
But the van der Waals gas at not-too-high temperatures is different.
There are regions where V gets smaller as you apply more pressure,
and there are regions where V gets larger.
That is, the isothermal compressibility

has regions where it’s positive, and “regions where it’s negative also exist.”
(The physical meaning of this is revealed at the very end. But, it’s exactly what everyone’s expecting.)
So, what we’re going to find from now on is
“From when” does it not behave like an ideal gas?!?!?!
“From when” does it show behavior slightly different from an ideal gas?!?!?!
We’re going to find that temperature!!!!!.
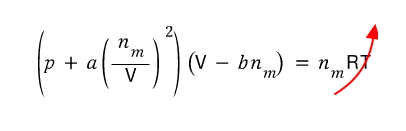
Clearly, when T is very large, the van der Waals gas also behaves like an ideal gas, right?!?!
If the right side is this large, the left side must also be large
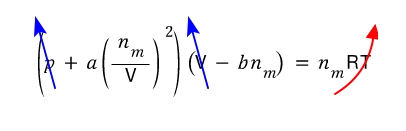
For both terms on the left to be large, first p must be large.
Also, V must be large.
Then -bn becomes negligible!
Also, if B gets large, (n/V)^2 also becomes small.
So it reduced to (p+~0)(V+~0) = nRT.
Alright, now let’s suppose the temperature gradually gets lower.
There will be a temperature
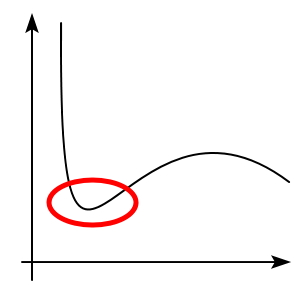
at which this kind of dented part starts to appear,

such a temperature will arise.
Alright… now this, I think a hand drawing is better than drawing it with a computer
Composited with the computer lolololololololollol
Alright anyway, we’re going to find such a T_c, so looking at the graph above, please look starting from the lowest temperature T that shows van der Waals behavior
At the temperature T_c, the extremum and inflection point of the van der Waals equation of state will become the same!!!!!
I’m going to use this condition to find T_c.
(When the inflection point and the extremum become the same, let’s call that point (V, p) as V_c and p_c respectively)
Riiight when
V = V_c, p = p_c, the inflection point and the extremum become the same, and the temperature at that moment is T_c
and from that point on, let’s say~ the change between van der Waals ↔ ideal gas behavior arises hehehehehe
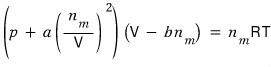
This is the van der Waals gas equation of state,
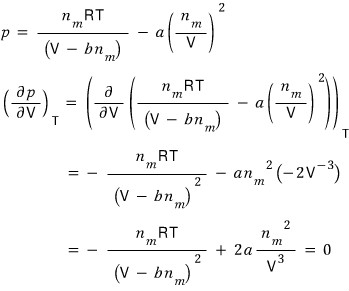
the extremum will be the part where

.
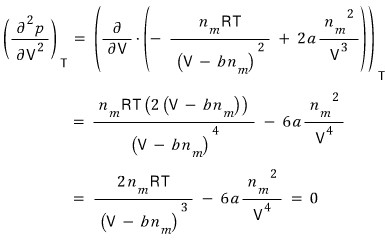
Then first I need to change the equation to be in terms of p, and differentiate that equation with respect to V
The inflection point will be where
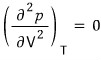
.
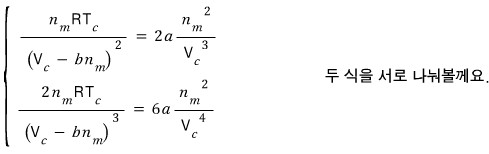
On the curve at temperature

, the point where both the first derivative and the second derivative become zero we said was

.
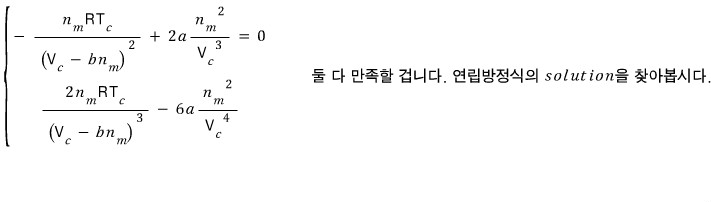
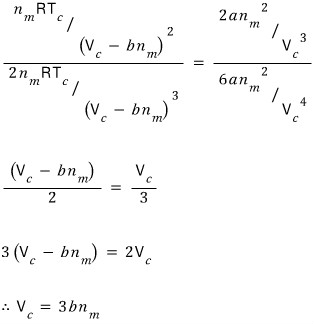
We got the critical volume V_c.
Using this, we can also find the critical pressure and critical temperature
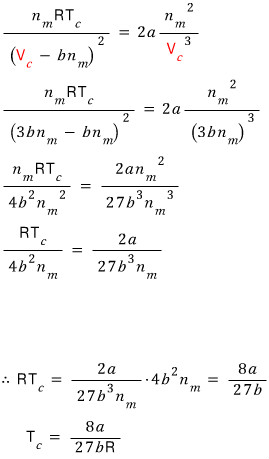
Where should we plug it in. Let’s plug it into the first-derivative equation.
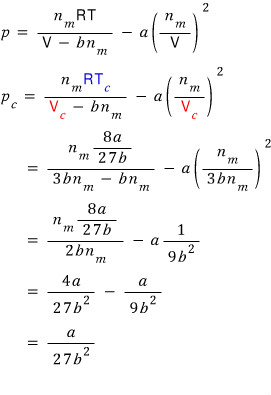
With the expressions for T_c and V_c obtained this way, let’s plug into the van der Waals gas equation of state and find even the critical pressure p_c.
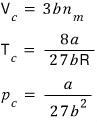
Wo~~~ow fwound them awl~~~ (sowwy)
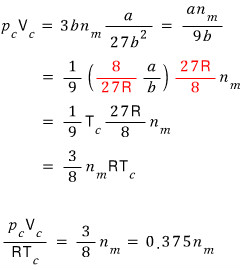
Huh?!?!?! It looks like we can tie these into one somehow?!?!?!
Originally written in Korean on my Naver blog (2016-06). Translated to English for gdpark.blog.